
The Box and Whiskers plot is a method for depicting groups of numerical data through their quartiles and it is a popular way to depict statistical information about data sets, yet the Racket plot package does not support such a plot type. In this blog post we’ll explore how to add this plot type to the plot package without having to modify the package itself, and we’ll look at some useful techniques of extending the plot package.
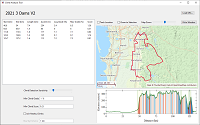
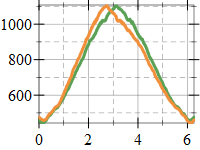
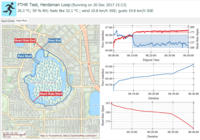
As part of preparing for a bicycle race in my local city I wanted to look at the climbs of the bike route and evaluate their difficulty. Since all the (free) online tools only provided basic analysis tools, I decided to write my own.
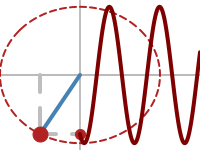
There is no specific animation function in the Racket plot package, but animations can be build by repeatedly plotting individual frames onto a canvas or image using plot/dc. The technique requires drawing the entire plot every frame, which will be inefficient for complex plots. In this blog post we explore how to construct plot animations using the set-overlay-renderers method of a plot snip, which is a more efficient method when plots are embedded in GUI applications.
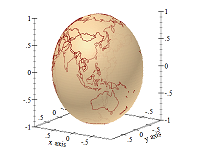
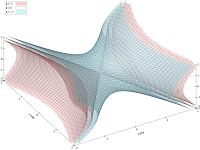
As part of writing the geoid package, I needed to visualize some geographic projections and I discovered that the 3D plotting facilities in the racket plot package can be easily used for this task. The geoid package and the projection it uses is somewhat complex, so, to keep things simple, this blog post covers the display of the country outlines on a globe loading the data from the GeoJSON file and using only basic plotting facilities.
While analyzing the data from my latest indoor trainer ride, I noticed that my FR–920 records altitude while running in “Indoor Trainer” mode. This means that I have a lot of altitude measurements at what is effectively the same elevation, so I had a look at how good altitude measurement really is.
A few weeks ago I accepted to become maintainer of the plot package and one of my first objectives was to setup an automated build and test runs using Github Actions. The plot tests were changed to verify automatically that they pass (previously they had to be visually inspected for correctness), and the technique may be useful in writing tests for other graphical packages and applications.

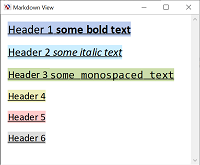
The Racket text% editor class can be used to display multi line text with formatting, such as fonts and colors; it is however, somewhat difficult to set it up and use its formatting capabilities. This blog post shows how to build a text view which allows inserting markdown text and the result will be formatted, with headers, links and images.
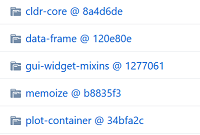
.. in which we look at how to manage the versions of packages used by a Racket application, and ensure that the correct package versions are used when building the application.
A dashboard for ActivityLog2 which allows determining threshold power, pace and heart rate for a running or cycling activity, and can set sport zones based on these values. To make things a bit more interesting, the dashboard also allows inspecting the activity interactively to see where the “best” segments are.
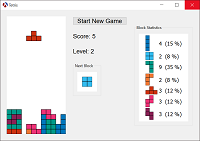
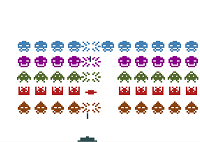
The previous blog post introduced the Tetris game mechanics and made the game playable. In this blog post we’ll look at how to build an actual GUI application around the game mechanics: we’ll keep score, increase difficulty, peek at the next block and more. As we do that, we’ll explore some more interesting things you can do with the Racket pict library, and look at some of the GUI facilities available in Racket.