Climb Analysis Tool
As part of preparing for a bicycle race in my local city I wanted to look at the climbs of the bike route and evaluate their difficulty. Since all the (free) online tools only provided basic analysis tools, I decided to write my own.
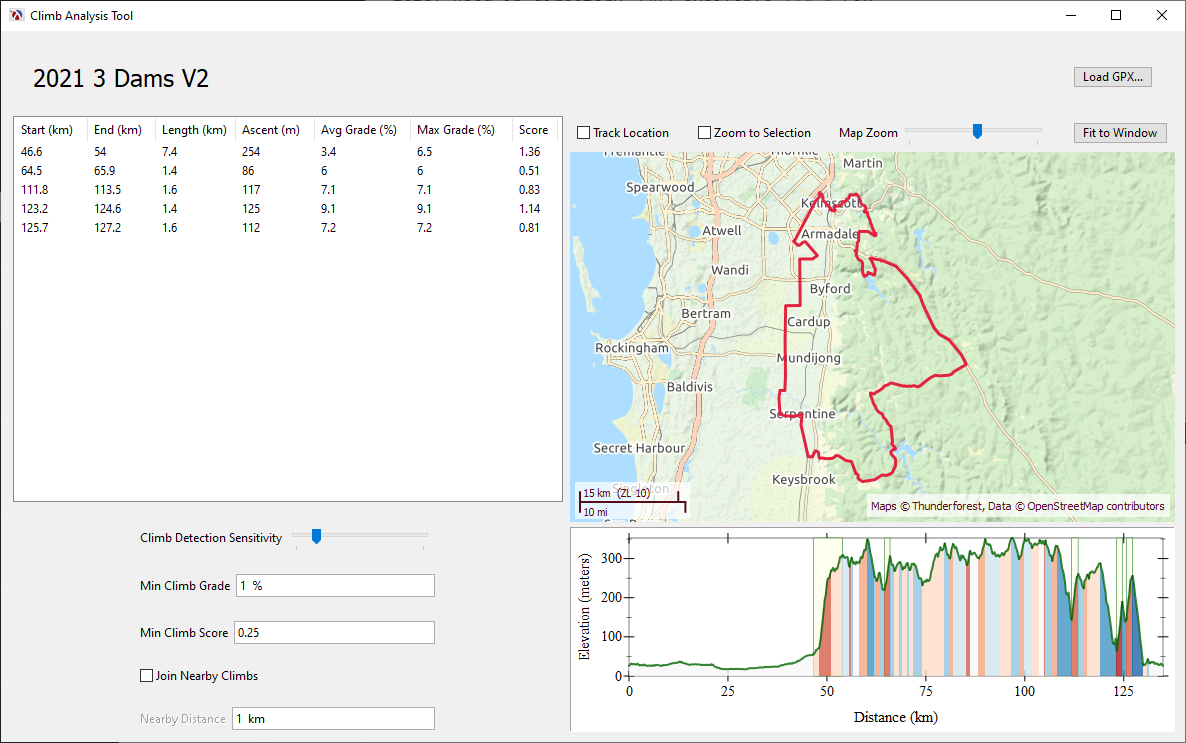
The result is a small Racket application, which can load GPX files (these can be readily exported from Garmin Connect or Strava), and detect and highlight the climbs on the route. The application is interactive, allowing to control various parameters for detecting the climbs as well as providing additional information when the mouse hovers over the plot.
If you want to use the application or simply look at the source code, it is available on GitHub as the AL2-Climb-Analysis project.
The Implementation
The construction of the initial version of this application was presented at RacketFest 2021, and if you have 30 minutes to spare, you can watch the video here:
The final version of the application is however a bit more complex than shown in this video. It now has a proper GUI where the user can load a file interactively and the various parameters for climb detection can be adjusted interactively. In addition to this, I also added a list view showing information about each climb. Another feature, which might not be obvious at first, is that the application remembers all its settings and GUI layout between runs: for example, if you adjust the size, or re-order the columns of the list view, they will remain the same even when the application runs again.
The application packs a lot of features, and it is still well under 1000 lines of Racket code (and this includes lots of comments). Even if you are not interested in analyzing climb data from bike routes, this application is a good example of building a data visualization application in Racket.