Posts tagged activitylog2
From having a nice and consistent elevation plot and an accurate total ascent/descent for an activity, to calculating effects of slope on performance, such as Grade Adjusted Pace for running, it is important to have accurate elevation data. Unfortunately, elevation data is one of the measures most prone to errors during an activity. On-line elevation services can be used to correct this data, but in ActivityLog2, I decided to use solution runs on the user’s computer only, and does not depend on cloud services.
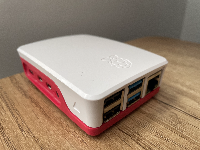
I wrote the ActivityLog2 as an application to analyze training data on the local computer, to avoid using a cloud service, and I also wanted a convenient way to download data off my Garmin watch without having to hook up USB cables to my laptop. The result is the PiFitSync project which I had running for several years now, evolving to download data from three generations of Garmin devices.
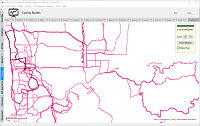
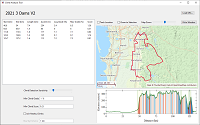
The Heat Map visualization in ActivityLog2 has been updated to handle large amounts of data, making it possible to show all 11 years worth of GPS points that I have, and still being able to show an interactive map, where the user can zoom and move the map while data is loading.
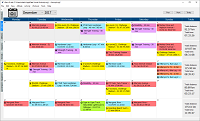
Can you write GUI applications in Racket? Different versions of this question shows up periodically on various Racket forums, and, of course, Racket does have a GUI Library. However, usually the person asking the question implies a bit more, and it is not always clear what this “a bit more” is…
Rather than attempting to answer the question myself, I decided to just put together some screenshots of an application I wrote using Racket.
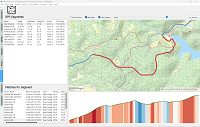
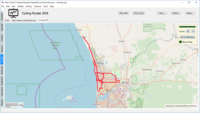
As part of preparing for a bicycle race in my local city I wanted to look at the climbs of the bike route and evaluate their difficulty. Since all the (free) online tools only provided basic analysis tools, I decided to write my own.
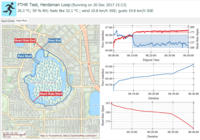
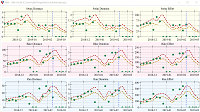
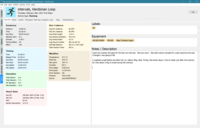
A dashboard for ActivityLog2 which allows determining threshold power, pace and heart rate for a running or cycling activity, and can set sport zones based on these values. To make things a bit more interesting, the dashboard also allows inspecting the activity interactively to see where the “best” segments are.
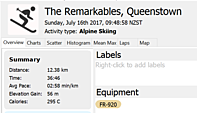
I wanted ActivityLog2 to show that my New Zealand skiing run started at 10am, rather than showing 6am, which is the local time in Western Australia, where I live. This feature took a long time to implement, plus it required a surprising amount of effort, and this blog post describes some of the implementation details.
A HeatMap chart allows displaying a collection of GPS activities on a map and it is a nice way to visualize GPS data. On-line tools provide this functionality, but I wanted to implement my own, displaying heat maps using data from my own computer, without having to upload it to another website.
When experimenting with a new data visualization or data analysis method, it is simpler to write a prototype as a separate application, to evaluate if it is worthwhile investing the effort of adding a full feature to ActivityLog2, this post illustrates the process used to write a “training load” dashboard application in Racket.
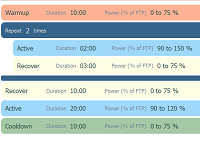
A Garmin fitness device can use workouts during a bike or run activity: they are a collection of steps with a duration and intensity (such as heart rate, pace or power). While running or biking, the device keeps track of the duration and will sound an alarm if the intensity is too high or too low. Workouts can be created on the Garmin Connect website, but I decided to write my own application for creating workouts.
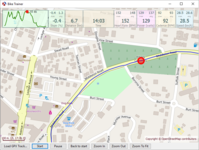
I bought a bike trainer last June for indoor riding during winter (which in the southern hemisphere is in July and August.) and I decided to write virtual ride simulator to use it. The simulator would follow a predefined course on the map: the current position would advance based on the speed received from the trainer, and the application would control the resistance based on the slope at the current location.
ActivityLog2 is a program that can analyze data recorded by fitness devices such as swim, bike and run sessions. It can be used as a training log and to gain insights about your training using reports and trend charts.