Heat Maps Revisited
The Heat Map visualization in ActivityLog2 has been updated to handle large amounts of data, making it possible to show all 11 years worth of GPS points that I have, and still being able to show an interactive map, where the user can zoom and move the map while data is loading.
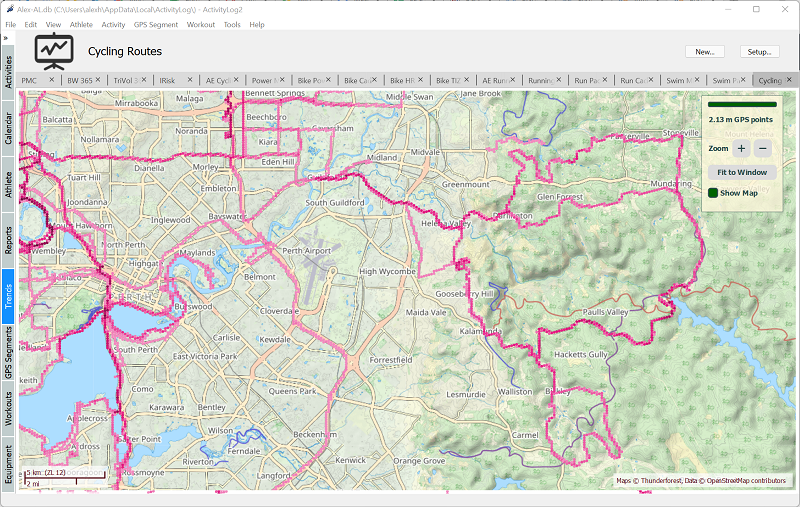
Here is an example showing 2.1 million GPS waypoints, all 11 years of cycling activities I have in my own database:
From a users perspective, the visualization has slightly changed, with dots being shown instead of lines, but the interface has remained the same, and the benefit is that larger data sets can now be displayed without performance degradation, making the visualization more useful.
Behind the surface there have been quite a few changes in the way that data is structured, so that data can be efficiently read form disk, aggregated, and displayed on the map.
The basic “building block” for the heat map implementation is the geoid, as implemented in the geoid library. This allows encoding each location, a position identified by latitude and longitude, as a 64 bit integer. The geoids are also ordered and, while the ordering has no geographical meaning, it allows fast and efficient lookups of locations in a SQL database, which ActivityLog2 uses. All waypoints in the database have their position encoded as a geoid and indexed is created for fast retrieval of waypoint data form the database.
Geoids can be defined at different levels of detail, allowing for a 64 bit integer to represent areas of different sizes on the Earths surface. Since they are integers, operations such as scaling up and checking if a geoid is inside another are very fast, making them suitable for implementing “point cloud” type data structures. The map-widget implements a new point cloud type visualization which relies on geoids to group locations quickly and scale them up at different levels of detail. It even works in a separate thread, allowing the user to stream data in and update the UI while the data is loading.
Interatctive HeatMaps in ActivityLog2
The heat maps were originally introduced back in 2019, and I ended that blog post with the following note, with regards to performance for large datasets:
For now, this is good enough for my uses, but something that might require improvements in the future.
Well, it only took 3 years for the improvements to arrive…