Interactive Heat Maps
A HeatMap chart allows displaying a collection of GPS activities on a map and it is a nice way to visualize GPS data. On-line tools provide this functionality, but I wanted to implement my own, displaying heat maps using data from my own computer, without having to upload it to another website.
Instead of explaining it, it is much easier to show how this all works, so here is a video:
Implementation Details
Implementing the actual heatmap is pretty straightforward, with less than 500 lines of Racket code, but it required several changes to the underlying libraries used by ActivityLog2, which are described in the following sections.
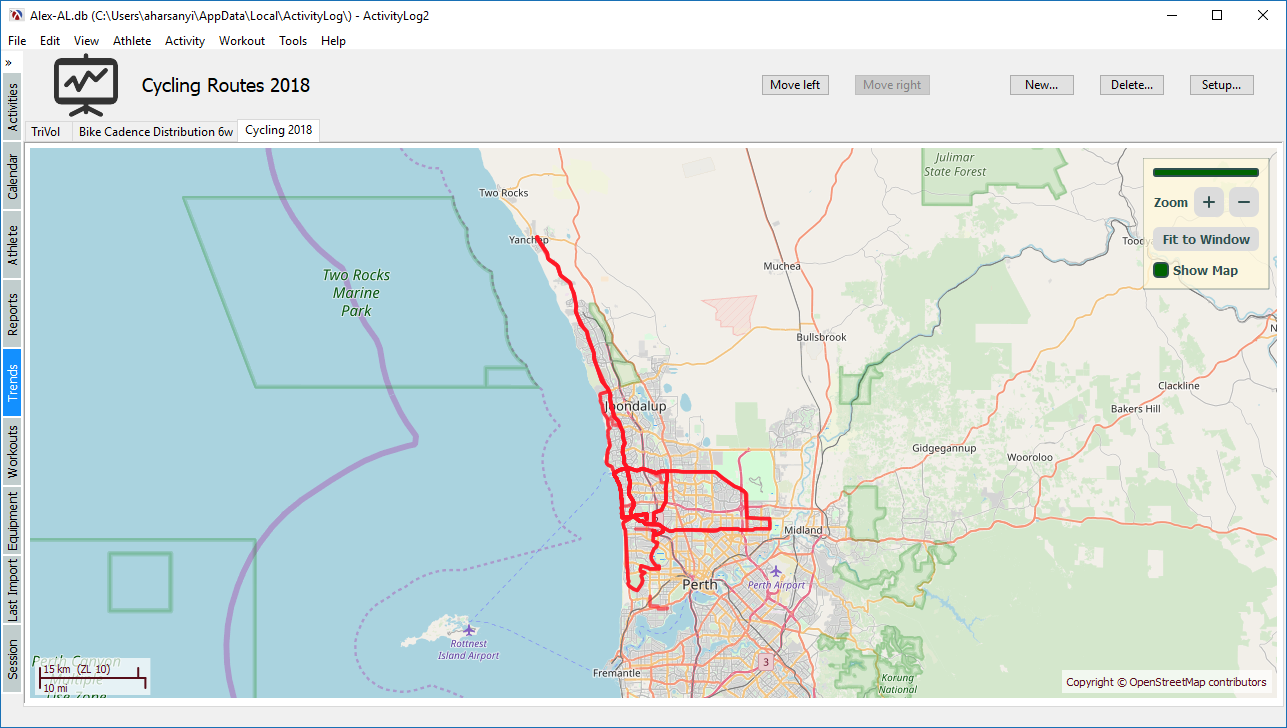
Interatctive HeatMaps in ActivityLog2
Trend Charts
The ActivityLog2 application allows defining trend charts which are plots based on groups of activities. The application will manage these plots, which includes displaying the data as a plot and saving / restoring the chart parameters. Each trend chart is represented by a class which has the following responsibilities:
-
prepare and display a GUI dialog box, which allows the user to view and edit the parameters for the chart, such as the date range and types of activities to be included
-
fetch and prepare the data and setup a plot and pass it to the application for display.
Each trend chart has to derive from the following trends-chart% interface and implement, at minimum make-settings-dialog, invalidate-data and put-plot-snip. There are some other optional methods, for example for saving an image of the plot or saving the plot data to file, plus some helper methods as well, which are not shown here:
1 2 3 4 5 6 7 8 9 10 11 12 13 14 15 |
(define trends-chart% (class object% (init) (super-new) ;; Create a new settings dialog for this class. (define/public (make-settings-dialog) ;; needs implementation #f) ;; Called when the chart parameters have been changed, and the data for the ;; chart will need to be updated. (define/public (invalidate-data) ;; needs implementation #f) (define/public (put-plot-snip canvas) ;; need implementation #f) )) |
This simple trend chart interface has proved flexible enough to allow implementing a wide variety of plots from bar chart plots to histograms ans scatter plots. The plot snips themselves can be made interactive, to allow more information to be displayed, and the canvas argument passed to put-plot-snip is a special editor-canvas% which allows defining floating snips for displaying mode information in an enhanced plot legend.
In fact, there are charts for Aerobic Decoupling, Mean Maximal, Body Weight, Histogram, Scatter, a Performance Management Chart, three different Training Volume charts. The user can define any number of actual trend plots from the defined types because each chart can have several instances to show the chart with different parameters.
Map Snips
At first sight, the trend chart interface is designed for generating plots, and the heat map chart requires displaying a map with overlayed data on top, which is not something that plot-snip can produce. However, while all the methods and class names have “plot” in their name, they actually work with snip% objects. I already had a map-widget% class which allowed displaying a map in a canvas%, but ultimately, the map drawing was done on a device context interface dc<%> which is common between both the canvas% and snip%. I did have to adjust the drawing methods however, because a snip’s draw method cannot assume that it can always draw at the origin, but other than that most of the changes were about re-factoring the drawing an event handling code from map-widget% into a common class and providing both canvas and snip interfaces for this. The result is that a map-snip% object can now be created and placed inside pasteboard% objects, just like plot snips. The new map snip is flexible enough that it can be used directly in the DrRacket REPL.
The heatmap-chart%’s put-plot-snip implementation can simply create a map-snip% and insert that into the canvas, instead of a plot snip produced by plot-snip. It was a pleasant surprise that a map-snip% was all that was needed to allow a map to be displayed as a trend chart.
Embedded Snip Controls
The map snip responds to mouse events, so you can drag the map with the mouse and use the scroll wheel to zoom in and out, but I wanted to add some extra functionality such as a progress bar as activities are loaded, a more obvious interface for zooming in and out, a button to reset the map to a default, in case the user zooms or moves the map away from the displayed activities. I also wanted to add a “show map” check box to be able to hide the map itself in case the display is too cluttered:
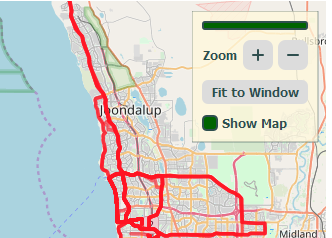
The MapControl snip overlayed over the map
The trend chart’s canvas allows inserting “floating snips”, which are simply snips that are not resized to fill the background, so the map control can be implemented as another snip. The snip%s provided by Racket are pretty simple and while they have a draw method and can react to mouse events, there are no controls which can be added to snips. This does not mean that such controls cannot be written, in fact I wrote an embedded-snip-button% class for use in the workout editor, this is a simple button which can be placed into individual snips and react to click events:
Snips in Workout Editor
The embedded-snip-button% was basic and specific to the task: it was my first experiment with providing snip controls. With some more experience with snips, I decided to give it a try with some more snip controls, so I implemented a button, a label a slider, a check box and a gauge control. There are too many details about the implementation to discuss them here, but below is a demo with a snip which has all the controls on it, with the source code for the demo available here. Since this is a snip% it can be inserted in the Racket REPL just like a plot or a map snip, it is however intended to be used inside a pasteboard% as part of a GUI application.
Snip Controls Demo
These controls will not win any design awards, but they are functional and I could implement the map control snip using them. What is currently missing is layout control and currently the owning snip has to place and resize these controls, perhaps in the next iteration of a “snip controls” project I will automatic layout panels as well, some basic layout facilities are already implemented in the demo.
Drawing The Heat Map Data
Perhaps the least polished feature is drawing the actual heat map data — a good implementation would have to take all the GPS points from the selected activities, group them, and display the data with a color intensity depending on the number of points in each such group. More sophisticated visualizations will also apply a Gaussian Blur pass on the data to make the heat map look more diffuse.
All this however cannot be done in real time — or at least I could not find a good way to do it, so instead I opted for just reading the GPS tracks and drawing them on the map with a small alpha value for the line, so that overlapping tracks look more intense. This is not ideal, but it is quick and the Racket graphics libraries can handle pretty large numbers of such tracks, although the application does run significantly slower if I try to display all 2000 activities that I have in my data base.
For now, this is good enough for my uses, but something that might require improvements in the future.