Posts tagged data visualization
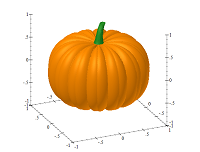
Inspired by the Digital Arts with MATLAB project, I wanted to check out if the Racket 3D Plot package could be used for a similar purpose, so I decided to plot a pumpkin…

… in which we explore using interval renderers and color maps to create a plot where the area under the line is shaded based on data from a second data series.

The Box and Whiskers plot is a method for depicting groups of numerical data through their quartiles and it is a popular way to depict statistical information about data sets, yet the Racket plot package does not support such a plot type. In this blog post we’ll explore how to add this plot type to the plot package without having to modify the package itself, and we’ll look at some useful techniques of extending the plot package.
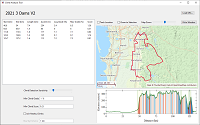
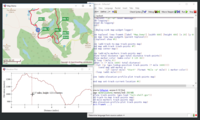
As part of preparing for a bicycle race in my local city I wanted to look at the climbs of the bike route and evaluate their difficulty. Since all the (free) online tools only provided basic analysis tools, I decided to write my own.
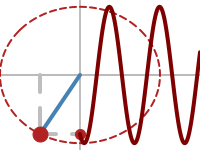
There is no specific animation function in the Racket plot package, but animations can be build by repeatedly plotting individual frames onto a canvas or image using plot/dc. The technique requires drawing the entire plot every frame, which will be inefficient for complex plots. In this blog post we explore how to construct plot animations using the set-overlay-renderers method of a plot snip, which is a more efficient method when plots are embedded in GUI applications.
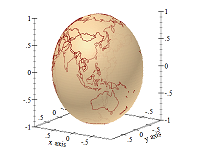
As part of writing the geoid package, I needed to visualize some geographic projections and I discovered that the 3D plotting facilities in the racket plot package can be easily used for this task. The geoid package and the projection it uses is somewhat complex, so, to keep things simple, this blog post covers the display of the country outlines on a globe loading the data from the GeoJSON file and using only basic plotting facilities.
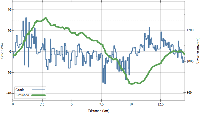
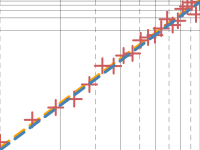
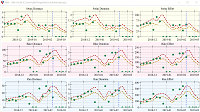
… in which we explore how to show on the same plot two data series that have different data ranges. The Racket Plot package does not support this functionality directly, but with the help of some data transformation, we can still achieve good results.
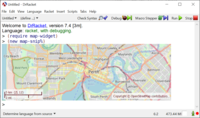
I updated the map-widget package to allow map objects to snip%’s so it can be inserted into a pasteboard% and a side benefit of this work is that maps can now be embedded in the DrRacket REPL — while this was not why I did these modifications, it does make for a cool demo.
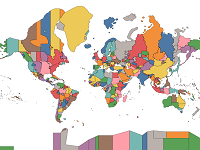
The timezone-boundary-builder project publishes GeoJSON files with timezone boundaries based on OpenStreetMap data, and I though it would be an interesting project to load this data in Racket, build some map visualizations with it and explore some of the Racket drawing facilities.
When experimenting with a new data visualization or data analysis method, it is simpler to write a prototype as a separate application, to evaluate if it is worthwhile investing the effort of adding a full feature to ActivityLog2, this post illustrates the process used to write a “training load” dashboard application in Racket.
This is a Racket GUI Widget which can display maps based on Open Street Map tiles — it allows embedding maps in Racket GUI applications. I originally wrote this code as part of the ActivityLog2 project and, since I wanted to use it in other projects, I decided to move it onto a separate package and publish it to the Racket package server.