Posts tagged data visualization
I announced my original plot overlay implementation on the Racket Users mailing list and the Racket developers were enthusiastic about these improvements and they suggested that I contribute them to the main plot package. They also suggested a different approach for implementing this feature, which results in more flexibility for implementing overlays.
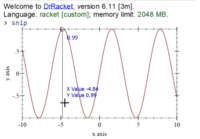
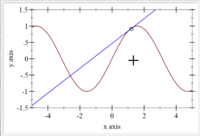
The Racket plot package produces interactive snip% objects which allow zooming of the plot area. While this is a cool and sometimes useful feature, the functionality is hard coded in the plot-snip% class inside the package. I extended the package to allow the user to customize the interactive features of the plot, to display additional information when the user hovers the mouse over the plot.