A Racket GUI Widget to display maps based on OpenStreetMap tiles
This is a Racket GUI Widget which can display maps based on Open Street Map tiles — it allows embedding maps in Racket GUI applications. I originally wrote this code as part of the ActivityLog2 project and, since I wanted to use it in other projects, I decided to move it onto a separate package and publish it to the Racket package server.
The map-widget is available as a Racket package and can be installed using raco pkg install map-widget, alternatively, the source is stored here.
Using the map widget
The widget can be created, like any other widget from the Racket GUI library, by specifying a parent widget. In this case, the parent widget is a top-level frame% object, but it can be any type of container widget like a panel%, for example. The code below will display the map in a new window and the map can be panned around by clicking and dragging the mouse and the map can be zoomed in and out using the mouse wheel. The first time the code runs, the map tiles will be downloaded from the tile servers and it will take some time for the map to load, but tiles are cached locally and the map will display faster on subsequent runs.
A GPS Track can be overlapped on top of the map using the add-track method. A GPS track is simply a sequence (list or vector) of track points, where each track point is a vector with the first element being the latitude and the second element the longitude. The track point vector can have additional elements — this can be useful to record elevation and other data in the same entry.
Once the track is loaded, it might not be inside the visible part of the map, the center-map method can be used to move the map to the newly added track:
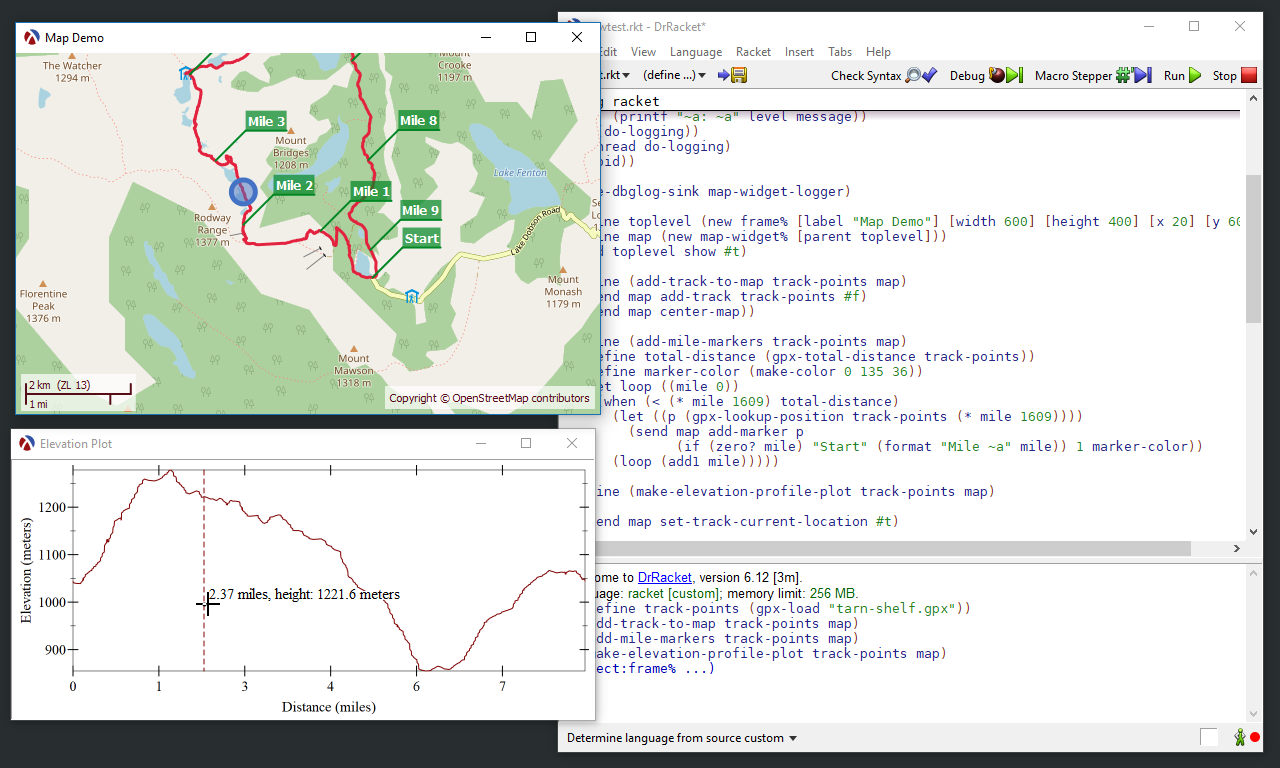
Position markers can be added to the map using the add-marker method. In the example below, markers are added for every mile on the track:
1 2 3 4 5 6 7 |
(define total-distance (gpx-total-distance track-points)) (define color (make-color 0 135 36)) (let loop ((mile 0)) (when (< (* mile 1609) total-distance) (let ((p (gpx-lookup-position track-points (* mile 1609)))) (send map add-marker p (if (zero? mile) "Start" (format "Mile ~a" mile)) 1 color)) (loop (add1 mile)))) |
Finally, the map widget has the concept of a current location — this is a position marked with a circle and can be set using the current-location method. In addition, the map widget can automatically move the map so that the current location is always visible, this is done using the track-current-location method.
In the example below, an elevation plot is displayed. The plot will display the current elevation under the cursor as well as the position on the map where this elevation point is located. For this code to work, the yet unreleased plot library is needed (see this blog post for more details):
1 2 3 4 5 6 7 8 9 10 11 12 13 14 15 16 17 18 19 20 21 22 23 24 25 26 27 28 29 30 31 32 33 34 35 36 37 38 39 40 41 42 43 |
;; Tell the map widget to move the map so that the current location is always ;; visible. (send map track-current-location #t) (define (plot-callback snip event x y) (if (and x y (eq? (send event get-event-type) 'motion)) (let ((elevation (gpx-lookup-elevation track-points x)) (position (gpx-lookup-position track-points x))) (define overlays (list (vrule x #:style 'long-dash) (point-label (vector x y) (format "~a miles, height: ~a meters" (~r (/ x 1609) #:precision 2) (~r elevation #:precision 1)) #:anchor 'auto))) (send snip set-overlay-renderers overlays) (send map current-location position)) (begin ;; Mouse left the plot area, clear the renderers and the current ;; location (send snip set-overlay-renderers '()) (send map current-location #f)))) ;; Data for the elevation plot. (define elevation (for/list ([p track-points]) (match-define (vector lat lon dst ele ts) p) (vector dst ele))) (define (make-snip width height) (parameterize ([plot-x-label "Distance (miles)"] [plot-y-label "Elevation (meters)"] [plot-x-ticks (ticks (linear-ticks-layout) (lambda (min max pre-ticks) (for/list ([pt pre-ticks]) (~a (exact-truncate (/ (pre-tick-value pt) 1609))))))]) (define snip (plot-snip (lines elevation) #:width width #:height height)) (send snip set-mouse-event-callback plot-callback) snip)) (define plot-frame (new frame% [label "Elevation Plot"] [width 600] [height 300])) (define canvas (new snip-canvas% [parent plot-frame] [make-snip make-snip])) (send plot-frame show #t) |
The final result can be seen in this video:
Loading and using GPX files
When experimenting with the map widget it is useful to have some GPS data. The map widget works directly with sequences of LAT/LONG data points, however it is more convenient to be able to load GPS tracks from files. To facilitate the examples presented here, I wrote a small library to read data from GPX files. This is not meant to be a complete GPX file reader, but only to support the examples presented here. The library provides the following functions:
gpx-load— loads data from a GPX file. It returns a vector of track points, each track point being a 5 element vector: latitude, longitude, current distance, elevation and timestampgpx-lookup-position— returns the position (latitude/longitude) of the point at a specified distance from the start of the track. The position is interpolated between two points available in the track data.gpx-lookup-elevation— returns the elevation of a point at a specified distance from the start of the track. This elevation is interpolated between two points available on the track data.gpx-total-distance— returns the total distance (length of the track)
The GPX library is available in this GitHub gist (it is just a single file), and the entire demo code is available in this other gist. The GPX file used in the example can be downloaded from Google Drive.