Threshold Analysis in ActivityLog2
A dashboard for ActivityLog2 which allows determining threshold power, pace and heart rate for a running or cycling activity, and can set sport zones based on these values. To make things a bit more interesting, the dashboard also allows inspecting the activity interactively to see where the “best” segments are.
This functionality was inspired by a blog post by Joe Friel, which explains how to determine power, pace and heart rate zones. The basic idea is that you go out for a bike ride or run, go ride or run hard for about 20 – 30 minutes and use the average power, pace and heart rate for that segment to determine a “threshold” value. Zones can be set as percentages of these thresholds. Note that this is really a rough summary of the process, you should read the original blog post for the exact test procedure.
The method requires you to go out and ride your bike or run, there is no way around that, but ActivityLog2 can help with the data analysis: it can automatically determine the best segment in an activity and determine the threshold and zones from this:
-
for cycling, the threshold value is usually called FTP (Functional Threshold Power) and ActivityLog2 can determine that value from any 20-minute FTP test.
-
for running, the threshold value is usually called Threshold Pace and can be determined from any running activity with a hard 30-minute interval in it.
In both cases, the corresponding threshold heart rate can be determined from the same activity, based on the highest heart rate maintained for 20 minutes.
Exploring the Activity
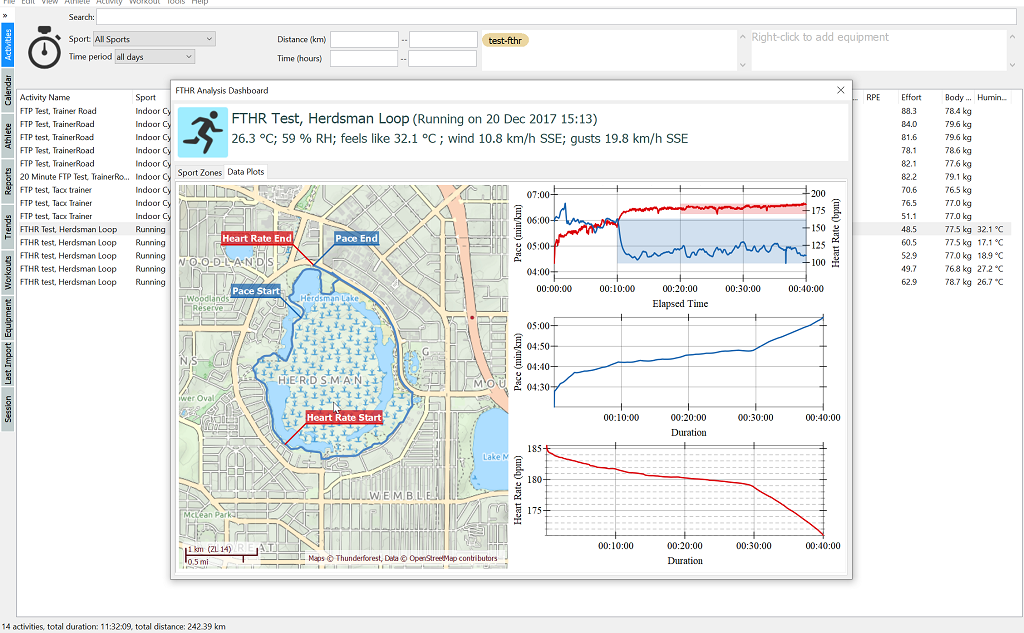
FTHR Analysis
To make the dialog box more interactive, you can also explore the activity, to see where the highest power, pace and heart rate threshold were.