Automating Tests for the Plot Package
A few weeks ago I accepted to become maintainer of the plot package and one of my first objectives was to setup an automated build and test runs using Github Actions. The plot tests were changed to verify automatically that they pass (previously they had to be visually inspected for correctness), and the technique may be useful in writing tests for other graphical packages and applications.
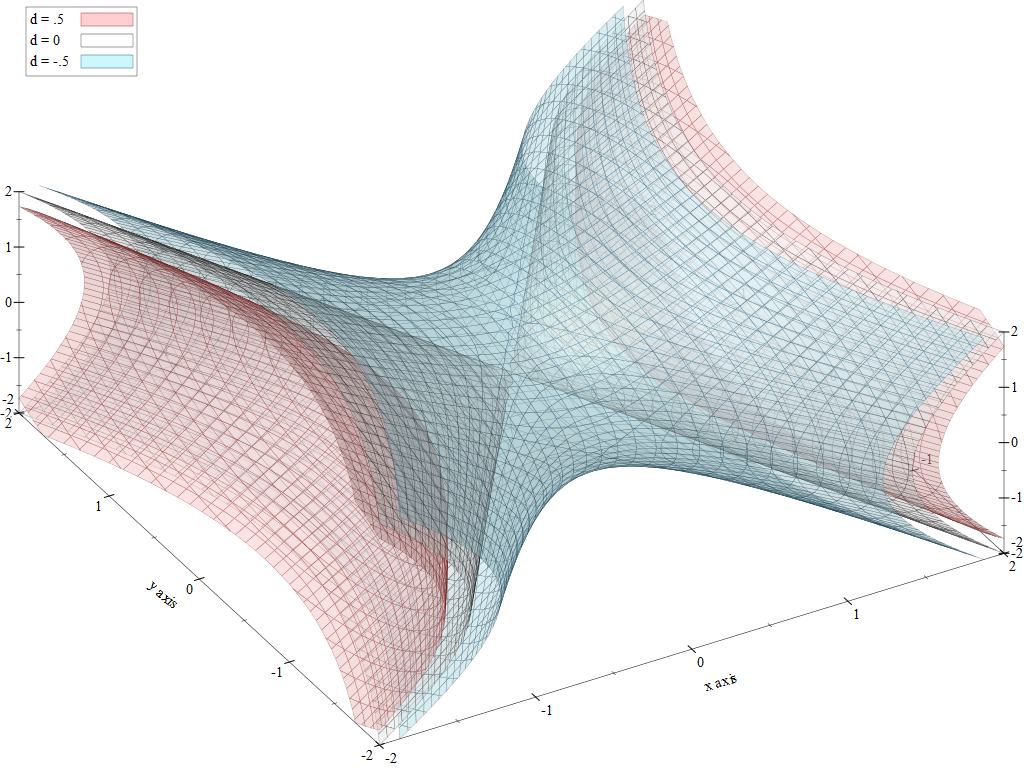
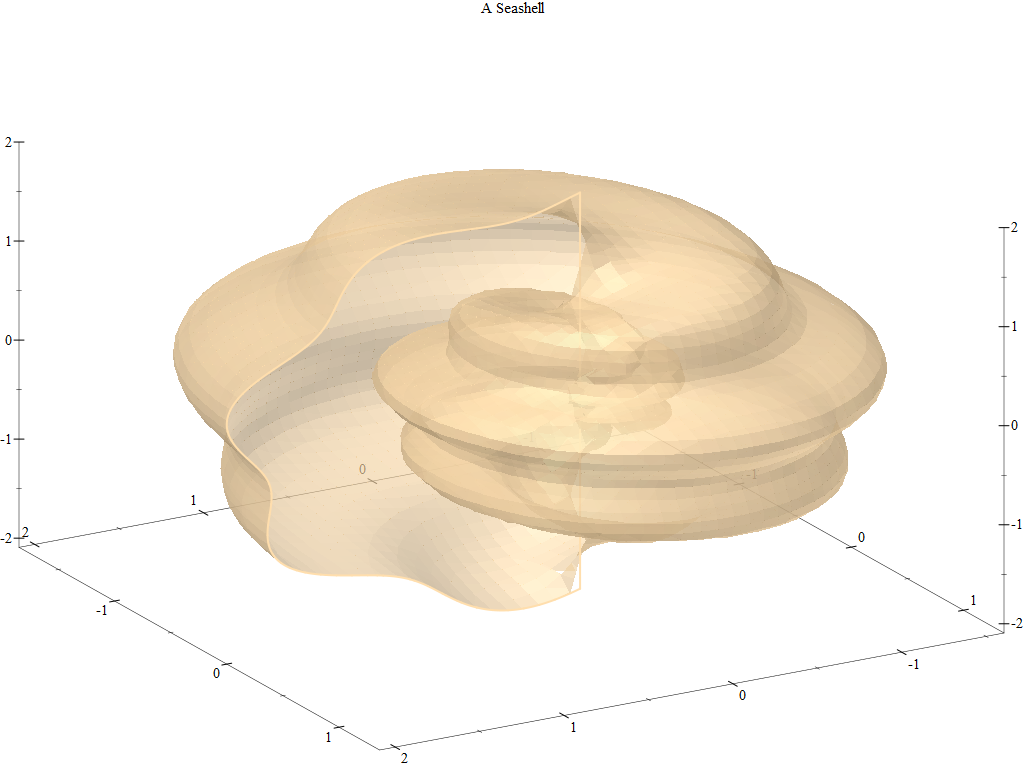
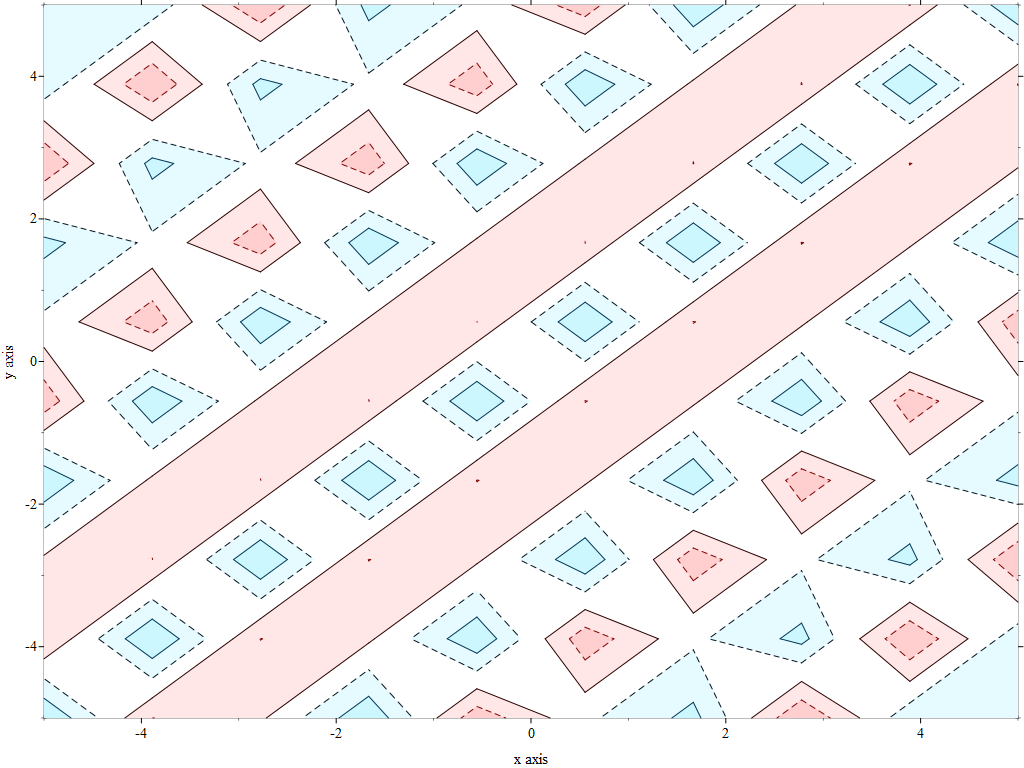
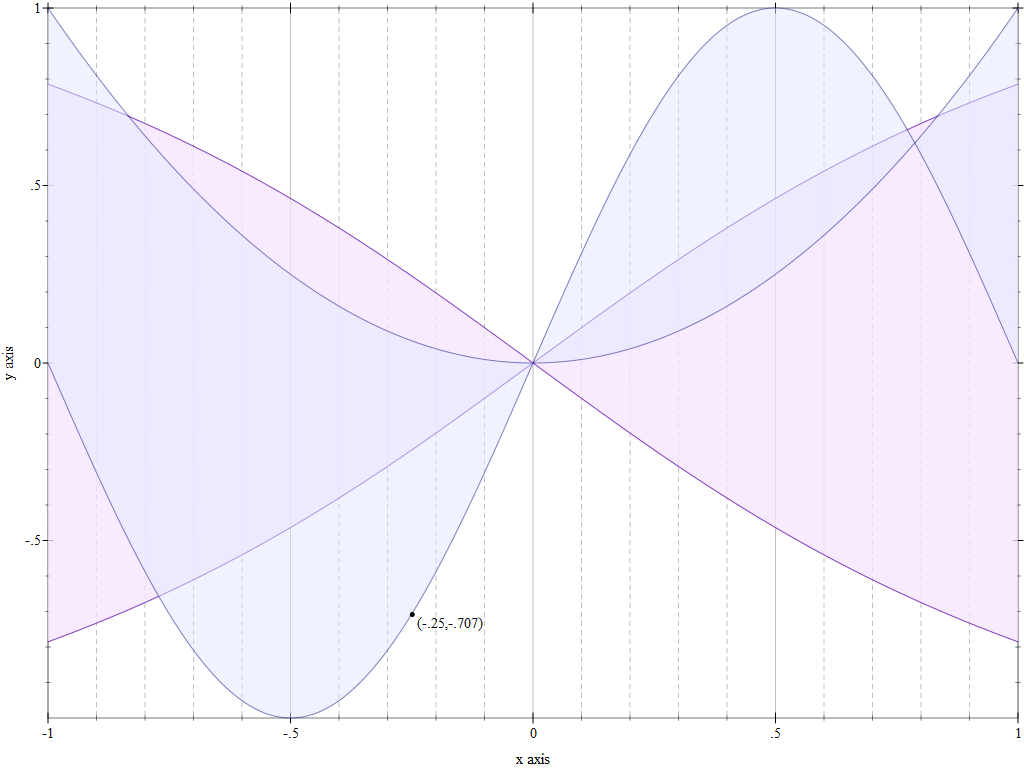
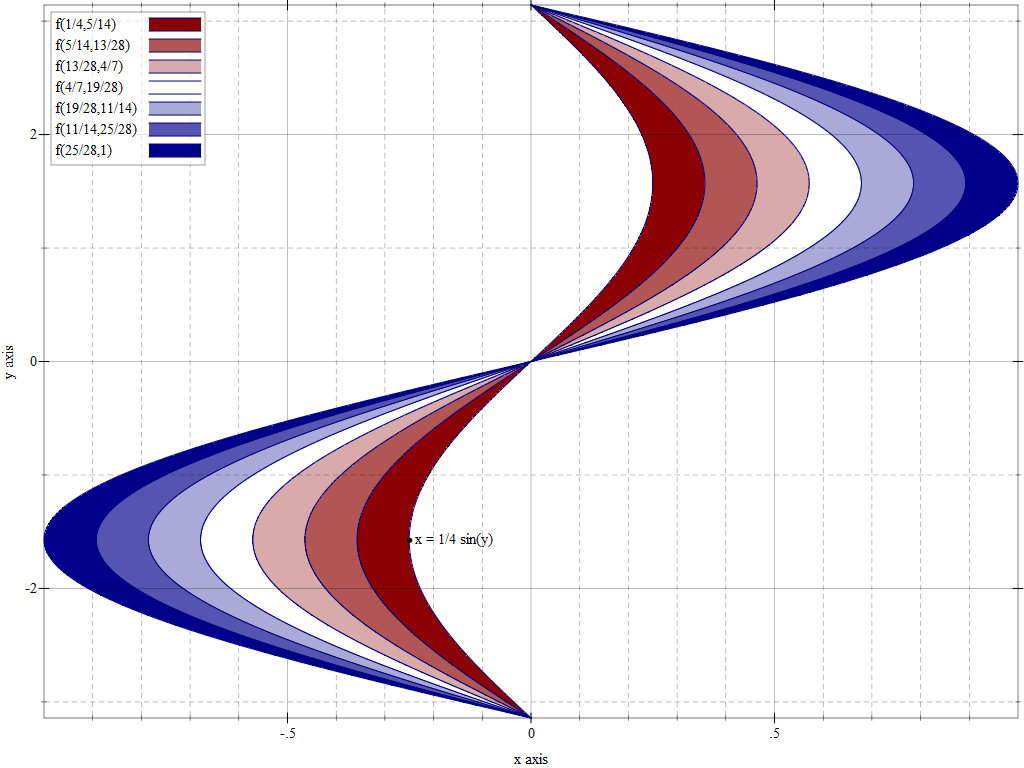
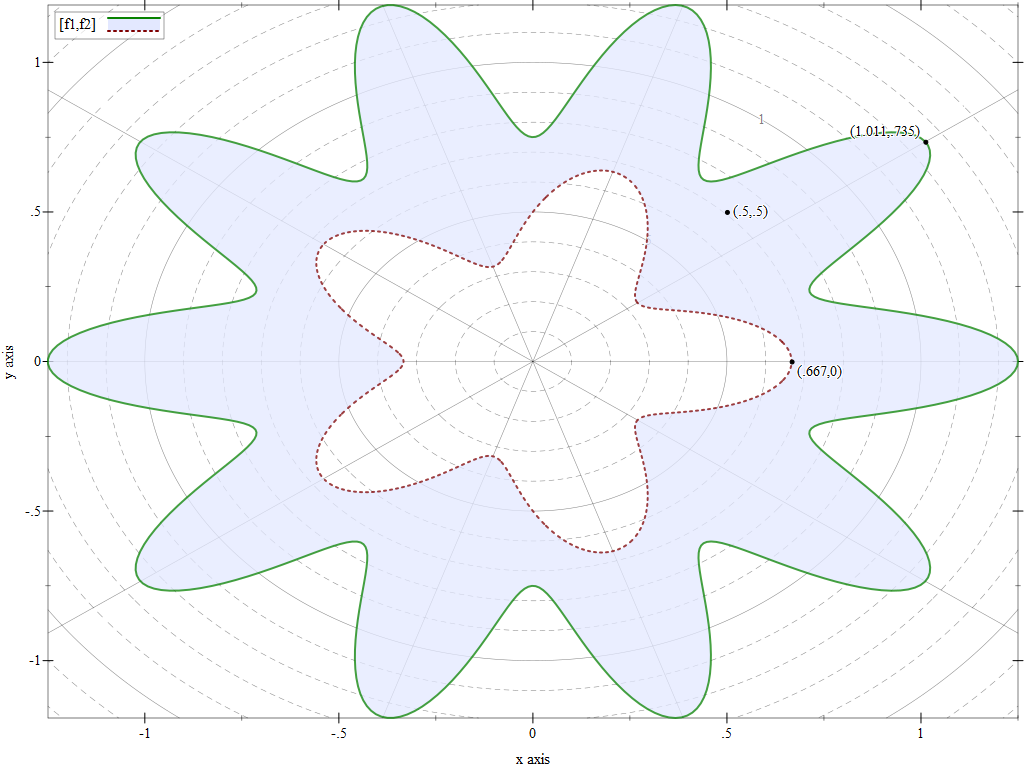
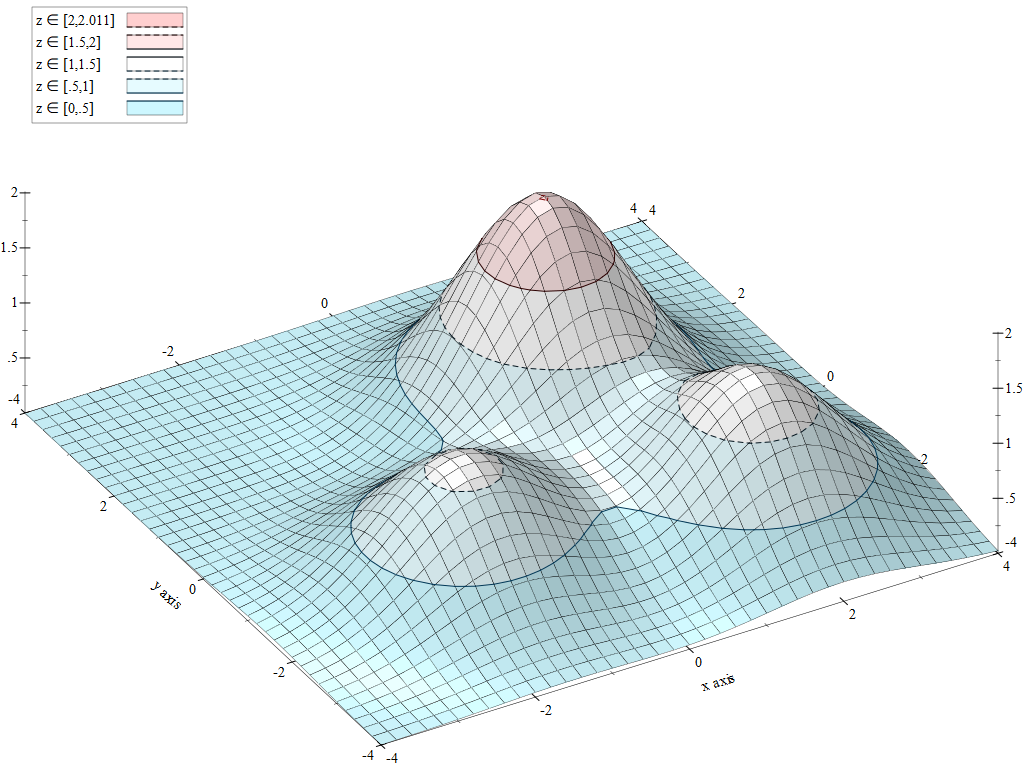
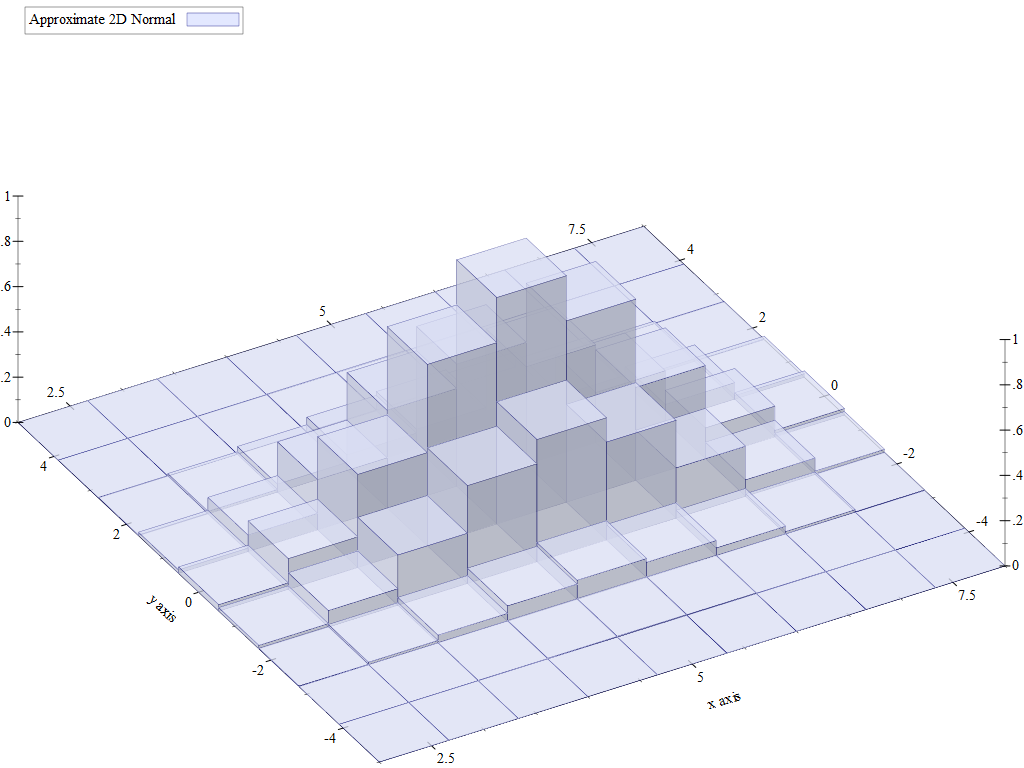
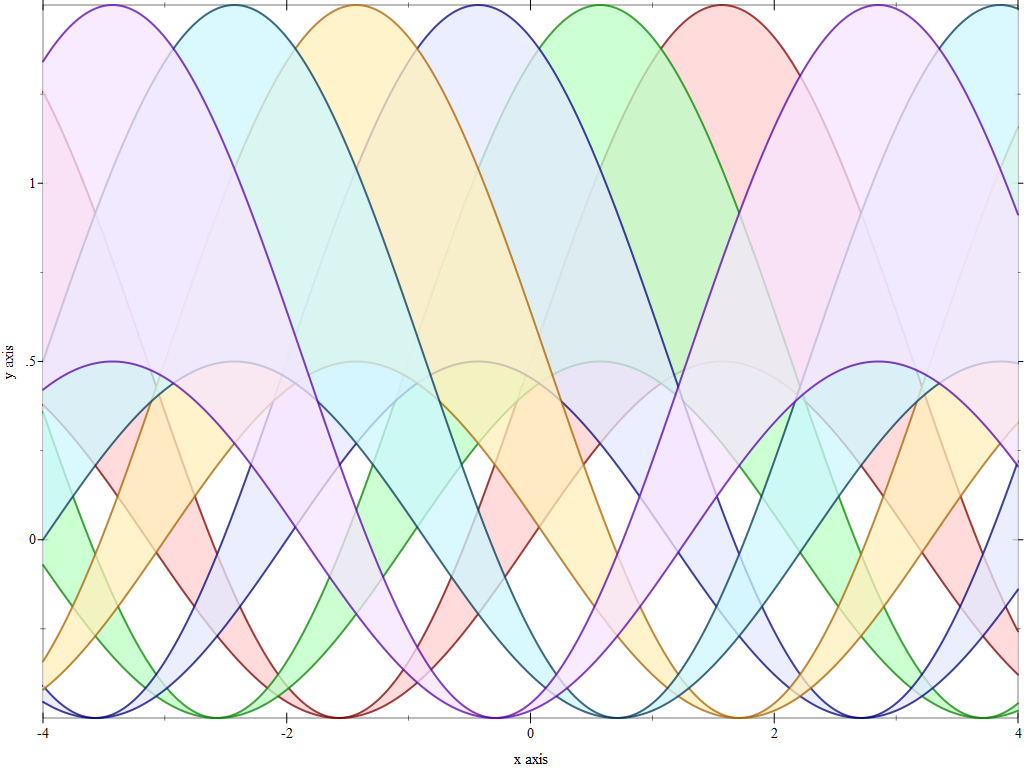
During this conversion process, I discovered that the plot package has an extensive test suite generating many interesting plots. Here are a few of my favorites:
Github Actions
The tests in the plot-tests package were designed for interactive use. They would output plots in the DrRacket REPL and the user could visually inspect them to see if they render correctly. This approach may work for a small number of plots to verify, but there are 508 such tests, and many of them test subtle things, such as whether the tick marks on the axis labels are drawn correctly or whether some points at extreme positions are rendered correctly.
Given the number of tests, it is no longer practical to just run them interactively. The DrDr server builds and runs these tests, but since there is no one to inspect the results, all this does is verify that tests run without raising exceptions.
DrDr will also build and test an entire Racket distribution, so for it to build and test a change to the plot package, the change has to be merged to the main project branch. This is a problem, as I would prefer to know that a pull request builds and the test pass before merging it in.
DrDr was designed and built long before Github Actions (and Github itself) existed, but today, GitHub offers mechanisms to automatically test code before it is merged in — several Racket packages already made use of this feature, so all I had to do was to copy and use their setup in the plot package. Thanks to Bogdan for his setup-racket Action which makes it easy to use Racket for the builds.
Testing Plot Renderers
The plot library is interactive: you can construct visual plots directly in the REPL. For example, if you type (plot (function sin -3 3 #:label "sin(x)")) in DrRacket, it will output a plot of the sine function:
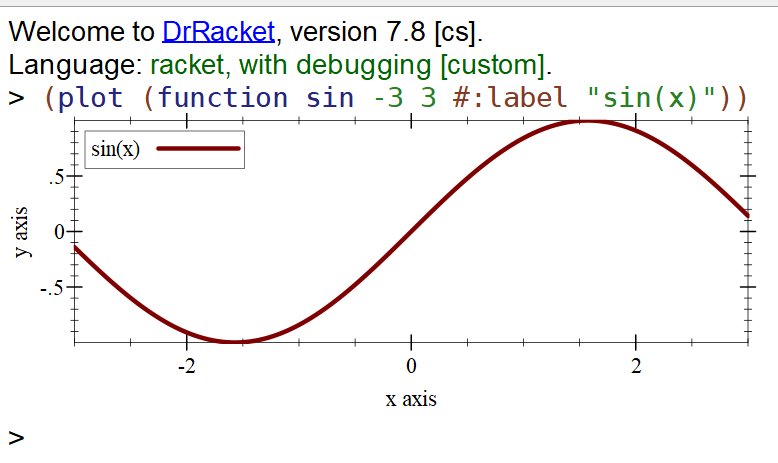
This plot can be visually inspected for correctness, but it is impractical to do this for many plots, and the tests for the plot package contain 508 such plots at the time of this writing. It would be nice to be able to automate the process, so both the plot command and its output are recorded, than checked automatically as part of a test suite.
The simplest idea is to use plot-file to generate a plot image which is saved to file and have the tests re-generate the image and compare it against the saved “sample” image. If the images are not the same, the test fails. This strategy has some complications of its own: first, drawing images will not produce absolutely identical pictures, as details such as anti-aliasing depend on the actual machine on which the image is generated. Second, the plot library uses fonts to draw axes, tick values and plot labels, and these fonts are platform specific, so the plot images produced on different systems will actually be different.
Recording Draw Steps
Instead of generating a PNG (or SVG) image for the plot, we can just generate the draw steps required for drawing the plot. After all, the plot library is just a high level DSL, which translates a high-level “program”, such as (function sin -3 3 #:label "sin(x)") into a sequence of draw calls on a device context interface, dc<%>. There are several classes which implement this interface, for example, a canvas for drawing on a GUI or a bitmap for drawing to a bitmap image.
One of these dc<%> implementations is record-dc%, and this implementation does not draw anything, instead, as the name implies, it just records the draw steps, and these can be retrieved using get-recorded-datum. For example, to find out what the draw steps are for plotting the sine function we can use the following snippet:
Note how we used plot/dc for plotting which plots directly to a device context dc<%> — all other plot functions are implemented in terms of this one (i.e. plot-file will create a bitmap, than use plot/dc on the device context of the bitmap).
draw-steps is a list of draw commands, and it looks something like the example below. There are 337 actual commands for drawing the plot, and most of them have been omitted. While the draw commands are a bit obscure, it is still possible to identify where different elements of the plot are drawn:
1 2 3 4 5 6 7 8 9 10 11 12 13 14 |
((do-set-pen! ((0 0 0 1.0) 1 solid round round #f)) (do-set-brush! ((255 255 255 1.0) solid #f #f #f)) (set-font (12 #f default normal normal #f default #f aligned)) (set-smoothing unsmoothed) (set-text-mode transparent) ;; ... lots of other draw calls ommited ;; ... this is where we draw the axis labels... (draw-text "x axis" 52.5 82.22216796875 #t 0 0) (draw-text "y axis" -0.22216796875 46.5 #t 0 1.5707963267948966) ;; ... this is where we draw the actual plot (draw-lines ((94.0 . 25.61311515106986) (93.90180360721442 . 25.327677256040936) ...)) ;; ... and this is where we draw the legend entry (draw-text "sin(x)" 56.0 15.333984375 #t 0 0)) |
Comparing Draw Steps
Of course, we are not really interested in analyzing these draw steps in detail. Instead, we can write them to a file and when the tests runs, it reads the saved draw steps and compares them against a freshly generated set.
1 2 3 4 5 |
;; Saving the draw steps (call-with-output-file "draw-steps.rktd" (lambda (out) (write draw-steps out))) ;; reading saved draw steps (define draw-steps (call-with-input-file "draw-steps.rktd" read)) |
Comparing draw steps is simply a matter of traversing a tree structure and checking if things are equal?, with the additional “variation” that numbers are checked if they are very close to each other instead of being equal, since most of them are floating point numbers:
Device Independent Draw Steps
Unfortunately, the draw steps produced by record-dc% are still platform dependent: the plot library queries the device context for font and text dimensions and aligns elements in the plot based on this informations. Since fonts have slightly different dimensions, all draw coordinates will be slightly different on different platforms. Since we use these draw steps for testing purpose only, we can use fake values for all font metrics. There are only three methods that need to be overridden to ensure consistent “font sizes” on all platforms:
1 2 3 4 5 6 |
(define mock-record-dc% (class record-dc% (init) (super-new) (define/override (get-text-extent text (font #f) (combine? #f) (offset 0)) (values (* 10 (string-length text)) 10 0 0)) (define/override (get-char-width) 10) (define/override (get-char-height) 10))) |
We can use mock-record-dc% instead of record-dc% to generate platform independent draw steps which means that tests build using them will run and pass on any platform:
Some Other Details
There are a few more details which need to be considered when constructing the helper functions for the plot tests. The full implementation is in the helpers file inside the plot-test package, and provides the following features:
-
draw step files are compressed using gzip (and decompressed when reading them in). A simple example such as the sine function above will generate a small file, but complex plots have lots of draw steps and the draw-step files for them were 5–10 Mb in size
-
there are helper functions for generating and comparing 2d and 3d plots. They differ only in the use of
plot/dcorplot3d/dcfunctions but they also accept the same parameters (e.g. plot title, width and height) as the actual plot functions, so plot tests can be written simply by substituting one of the plot functions with the test ones. -
when a test fails, the helper functions will generate a new set of draw step files, and a new sample image which can be compared against the saved one. Github Actions is also set up to upload these new files as a “build artifact” to be inspected when a test fails.
Converting the existing files to use the new mechanism was an interesting exercise in itself (remember that there are 508 such plots), but that involved using Emacs macros, which don’t fall under the Racket topic… If you want to look at the results, they are part of two pull requests: plot/#62 and plot/#63.