Interactive Overlays With the Racket Plot Package
The Racket plot package produces interactive snip% objects which allow zooming of the plot area. While this is a cool and sometimes useful feature, the functionality is hard coded in the plot-snip% class inside the package. I extended the package to allow the user to customize the interactive features of the plot, to display additional information when the user hovers the mouse over the plot.
Update 20 Mar 2018 There is an updated blog post detailing the actual code that made it into the official racket plot package. The overall functionality and capabilities remain the same but the API is different.
A simple example
Here is a simple example that replaces the default zoom behavior of the plots with code that displays the current value of the function at the mouse location:
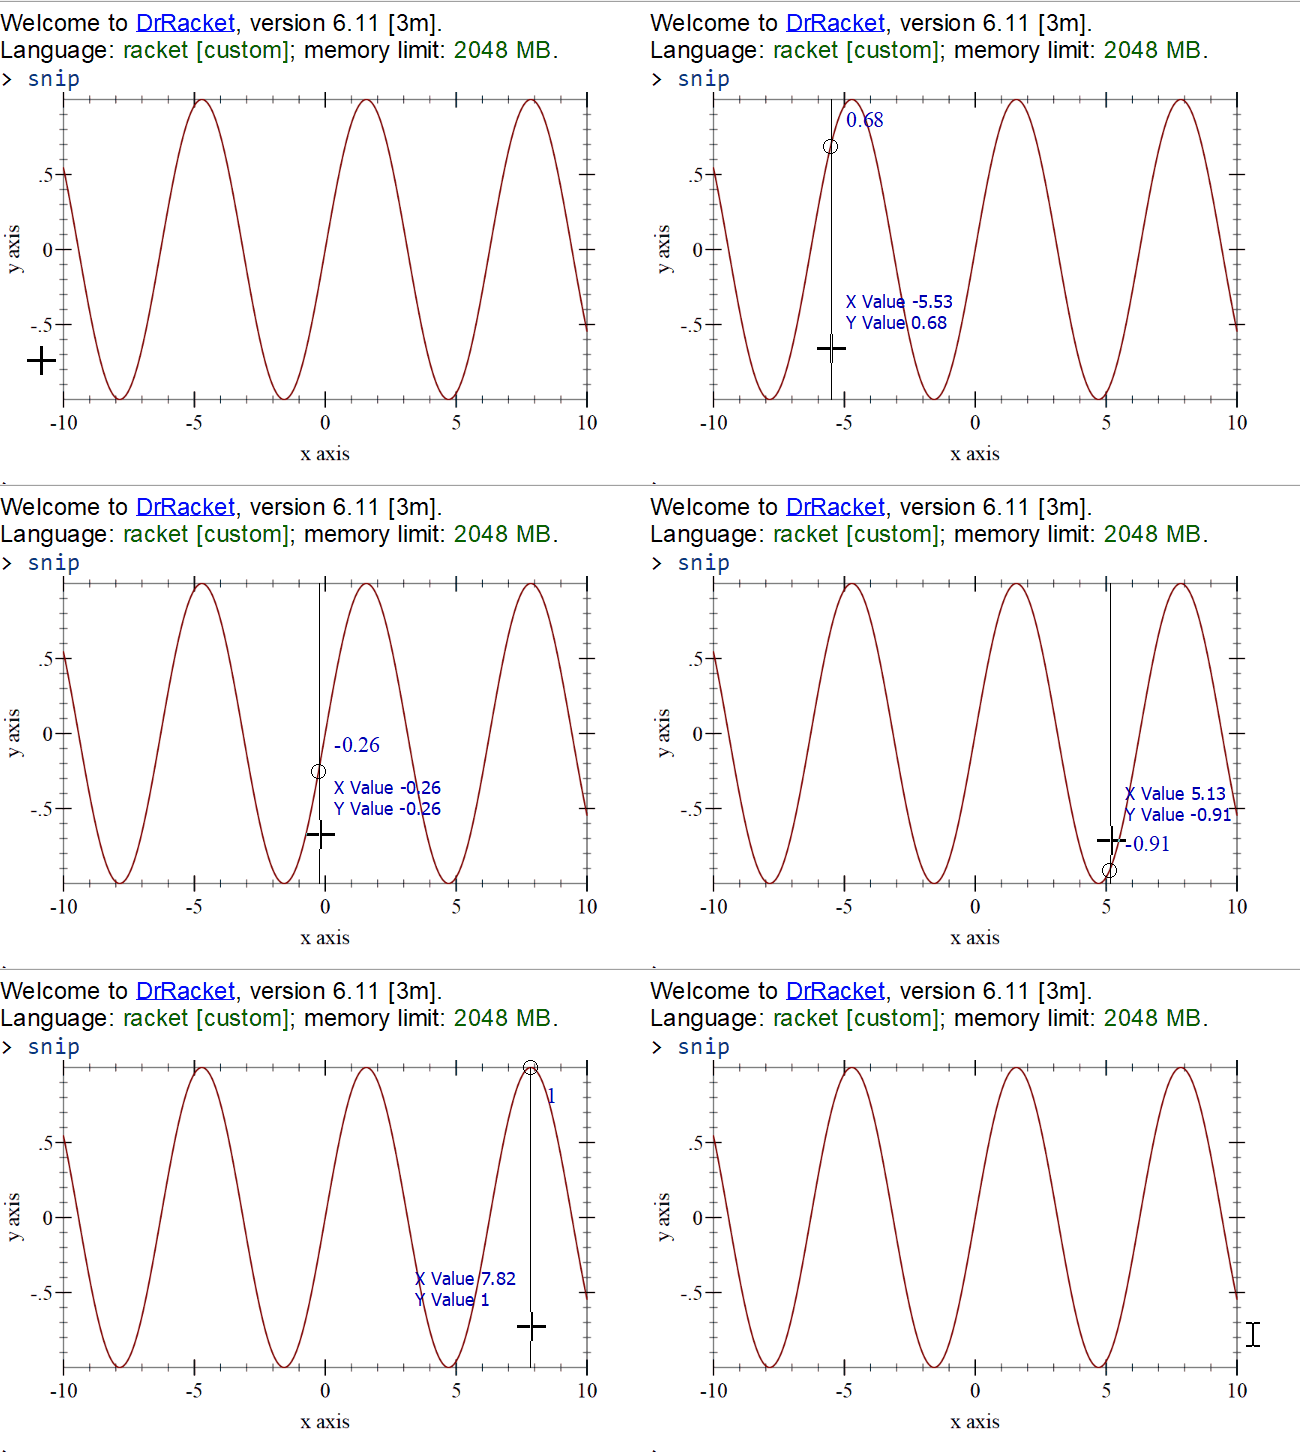
NOTE: The above plot was generated by running inside DrRacket the source code shown below. The program depends on a special build of the plot library which you can find here, note that the code is on the “ah/interactive-overlays” branch. You will need to install this as a local package. If you don’t know how to do that, this post may help.
The program works by first creating a plot object using the plot-snip function. Next, the callback on-hover is added to the resulting plot snip object using set-mouse-callback. This callback is invoked each time the mouse moves over the plot and the X and Y coordinates passed to the callback are in the plot domain, in the example above, X will be between –10 and 10, as this was specified to the plot function, and Y will be between –1 and 1 which is the range of the sine function. The callback itself can add any number of overlays to the plot and they will be shown. In this example, it adds a vertical line, a marker at the function value at the mouse location and a label where the mouse cursor is.
1 2 3 4 5 6 7 8 9 10 11 12 13 14 15 16 17 18 19 20 21 22 23 24 25 26 27 28 |
#lang racket (require plot pict) (define (add-pict-overlay plot-snip x y pict) (send plot-snip add-general-overlay x y (lambda (dc x y) (draw-pict pict dc x y)) (pict-width pict) (pict-height pict))) (define (on-hover snip event x y) (send snip clear-overlays) (when (and x y) (define sx (sin x)) ;; Add vertical line at current position (send snip add-vrule-overlay x) ;; Mark the value on the plot at the current position (send snip add-mark-overlay x sx #:radius 10 #:label (~r sx #:precision 2)) ;; Add a picture at the current mouse location (define p (vl-append (text (format "X Value ~a" (~r x #:precision 2))) (text (format "Y Value ~a" (~r sx #:precision 2))))) (add-pict-overlay snip x y p)) (send snip refresh-overlays)) (define snip (plot-snip (function sin) #:x-min -10 #:x-max 10 #:width 400 #:height 250)) (send snip set-mouse-callback on-hover) snip ; show the snip in the REPL. |
Vertical rule and function value
The image below shows the application of this basic idea to an actual use case: to show the current value of the data at the mouse location. This example is a bit more complex, as there are two linked plots and when the mouse hovers over one of them, the current value at that position is shown on both of them — this mechanism can be extended to any number of plots.
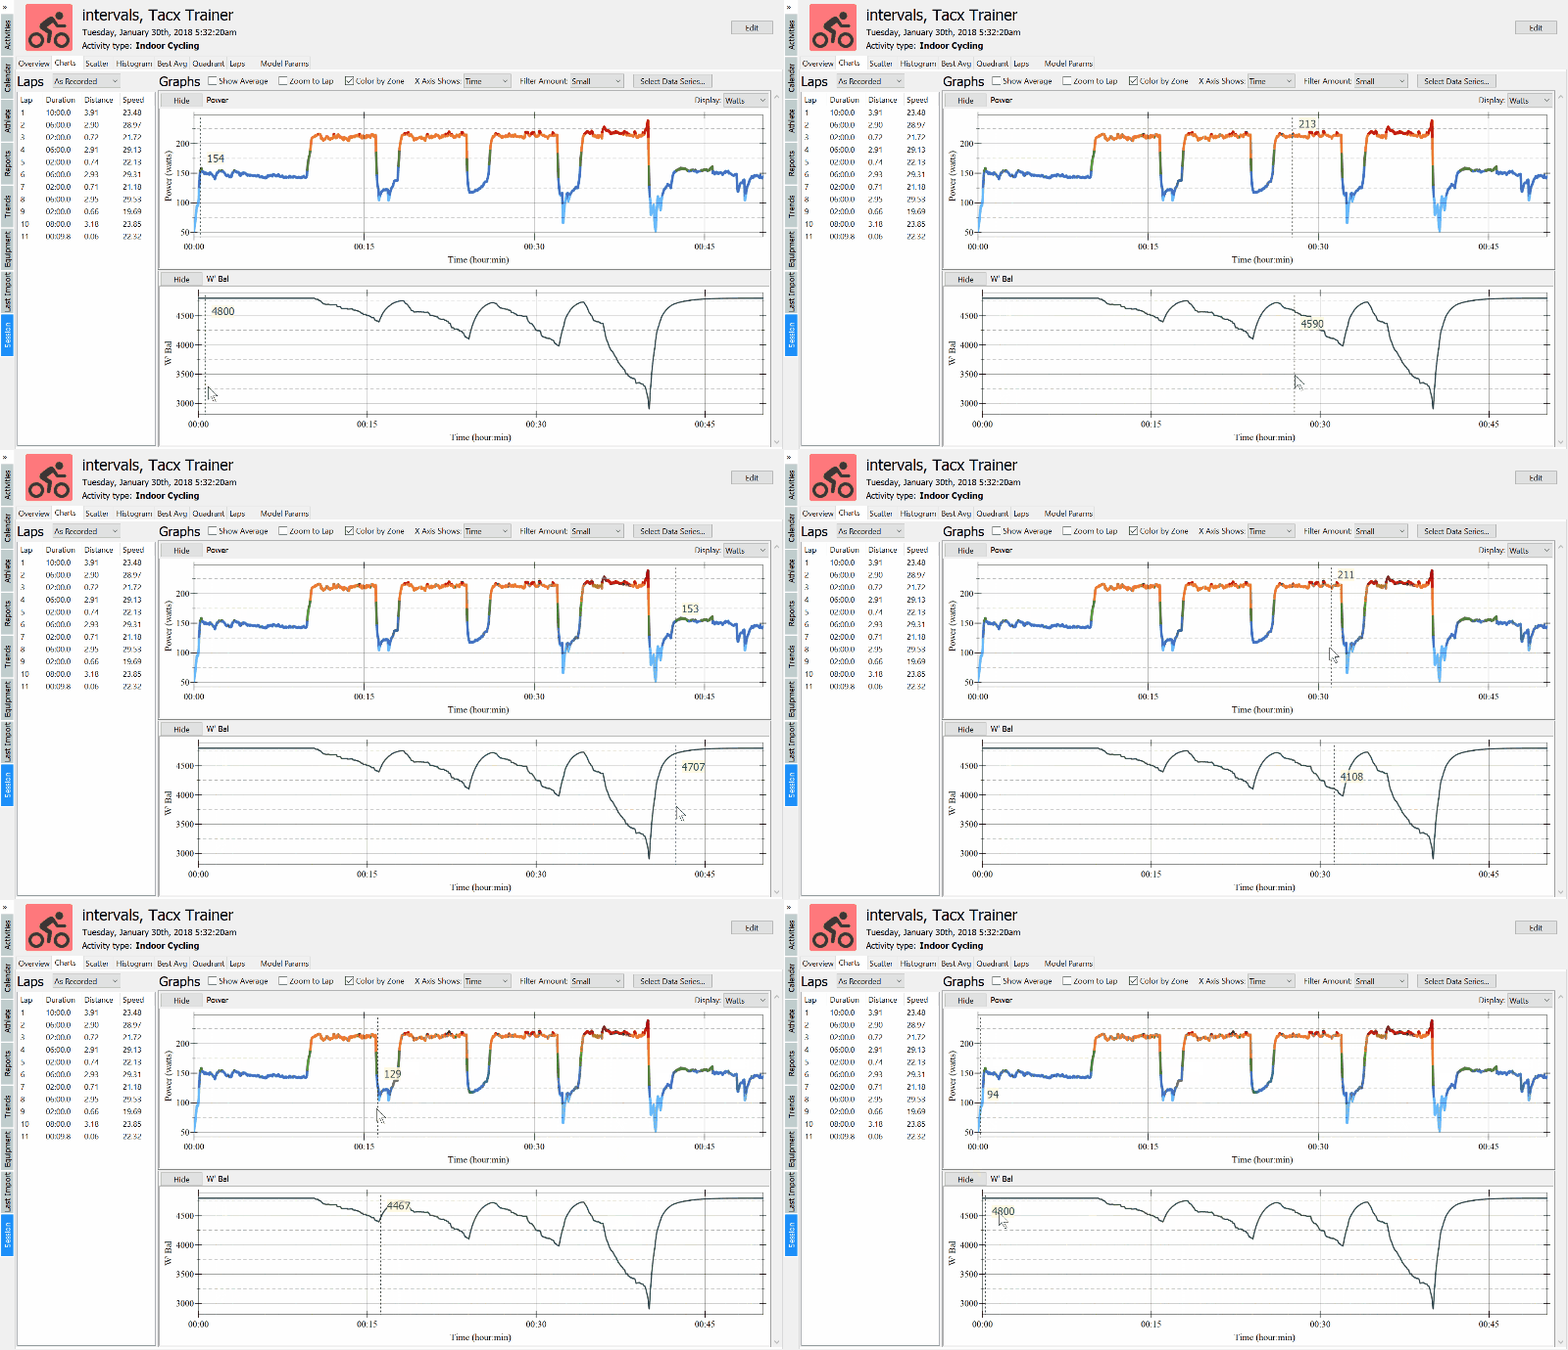
This example is from the ActivityLog2 application. This is implemented in the draw-marker-at method in the rkt/inspect-graphs.rkt file.
Highlight regions
Another use case is to highlight a region on the plot. In the image below, the current lap of an activity is highlighted when the user selects a lap on the left. This functionality could also be achieved using the lines-interval plot renderer, but this requires redrawing the entire render tree each time a new lap is highlighted. Since a usual bike ride contains between 5000 and 10000 data points rendering it takes some time and the lap highlight would introduce unpleasant delays.
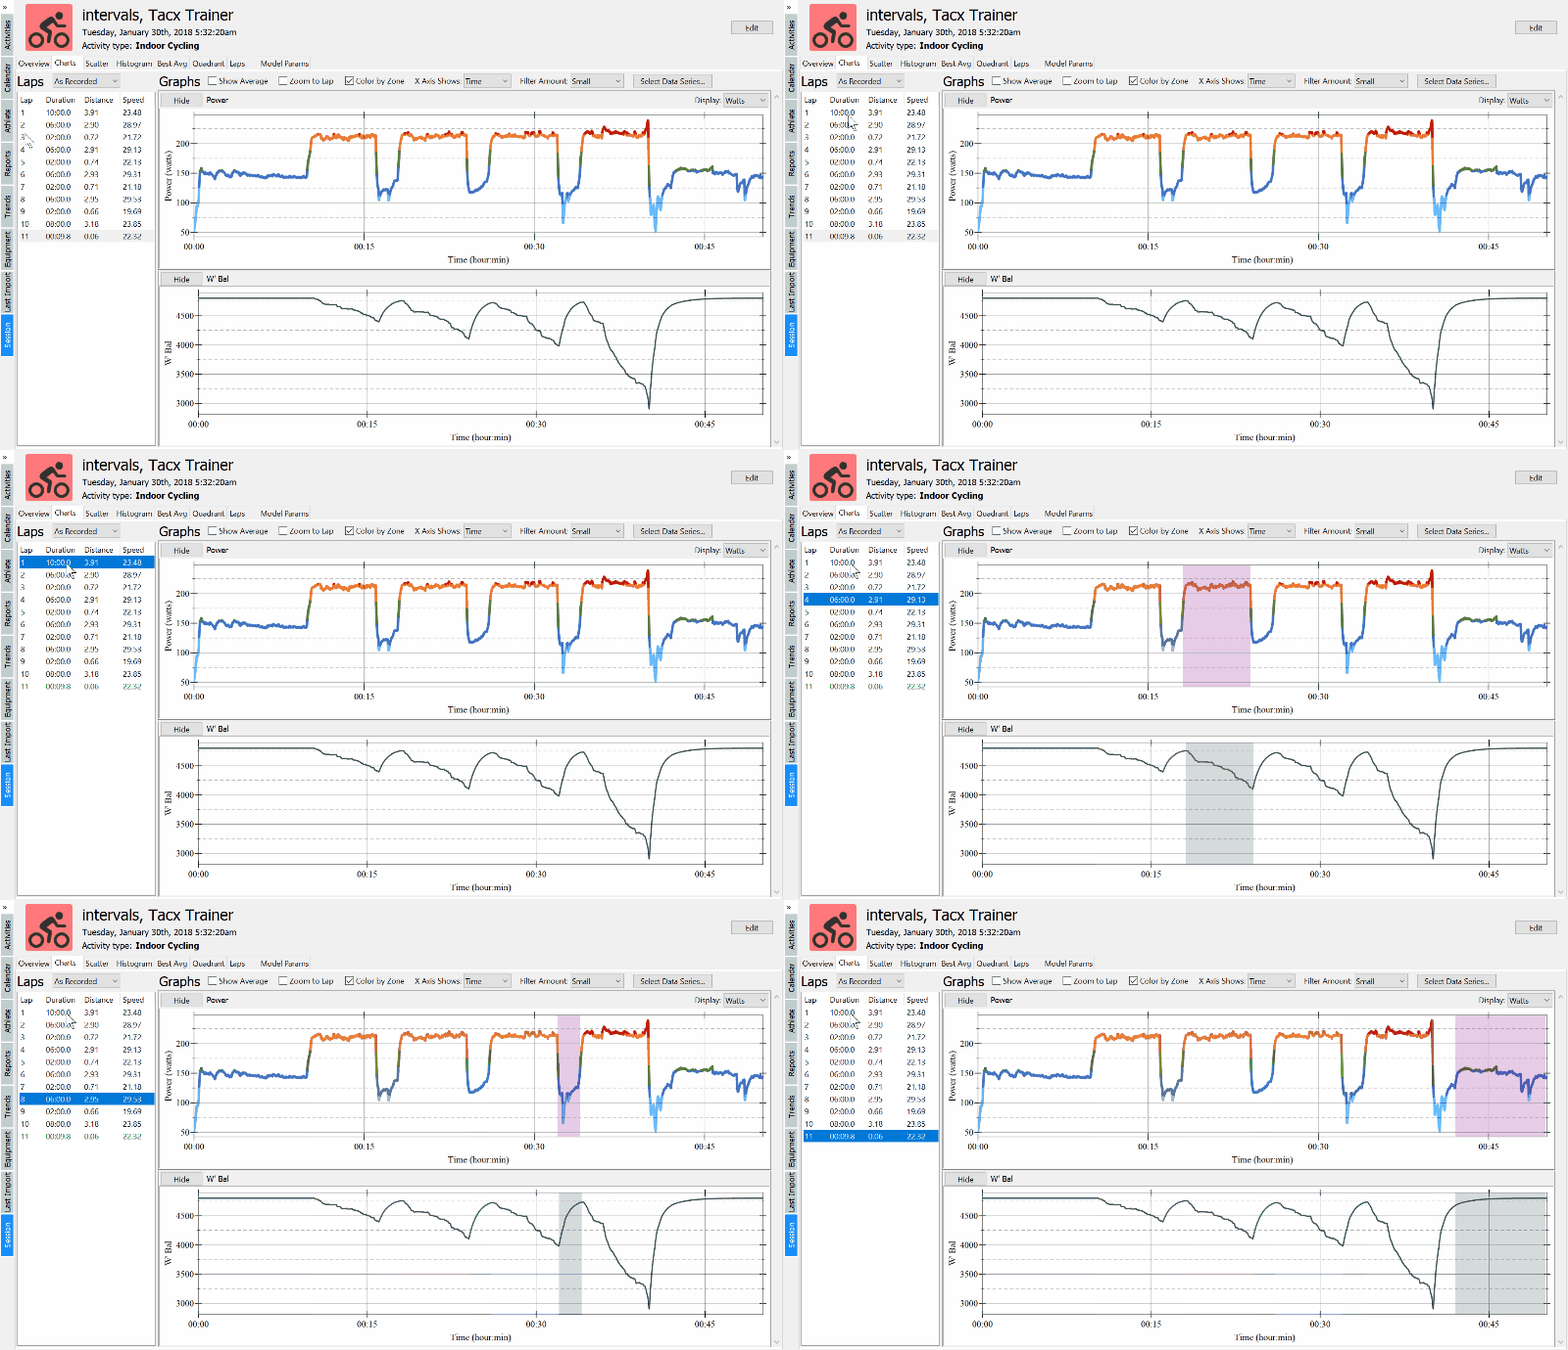
This is implemented in the highlight-interval method in the rkt/inspect-graphs.rkt file.
Display complex information
Sometimes a plot is based on complex underlying information and displaying it is really useful. The data for the power-duration plot shown below is constructed as follows:
- for each bike session, the mean maximal values are determined for a set of predefined durations— that is, the best power maintained over 10s, 15s, 1min, etc, over the entire ride.
- for each duration, the best power for that duration is selected from the list of sessions
- spline interpolation is used to plot these power values as a function of duration (the purple line on the plot)
- a theoretical power-duration model is fitted over this data
This is a lot of information, which ultimately is represented as two curves on a plot. Using interactive overlays, the underlying data can be explored: the maximal power and modeled maximal power at the current duration, and the two original data points from which the interpolation is done, including the date when the bike sessions occurred.
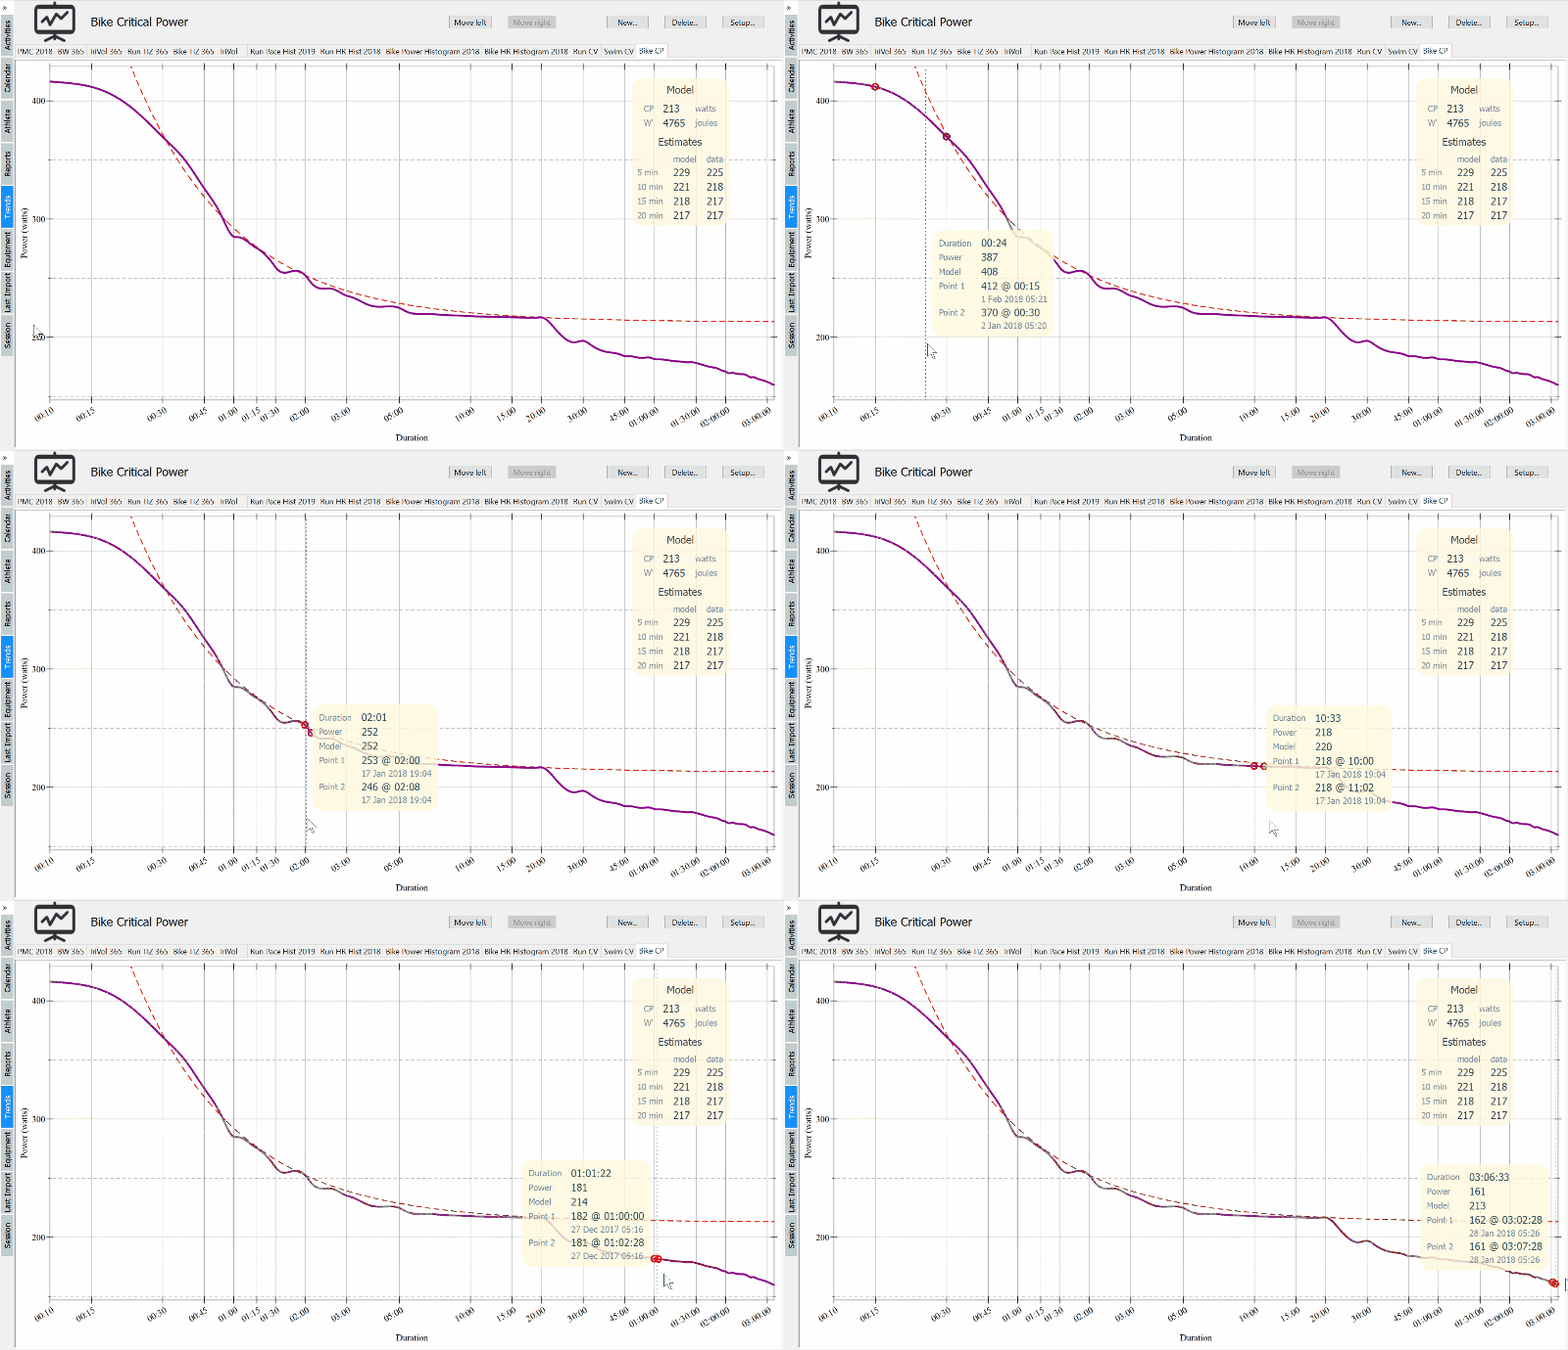
This is implemented in the plot-hover-callback in the rkt/trends-bavg.rkt file.
Displaying information on histogram plots
Histogram plots benefit from displaying additional information about the bar under the cursor. In the example below, the underlying cummulative times that form the basis for the histogram bars are displayed when the mouse is moved over the relevant section.
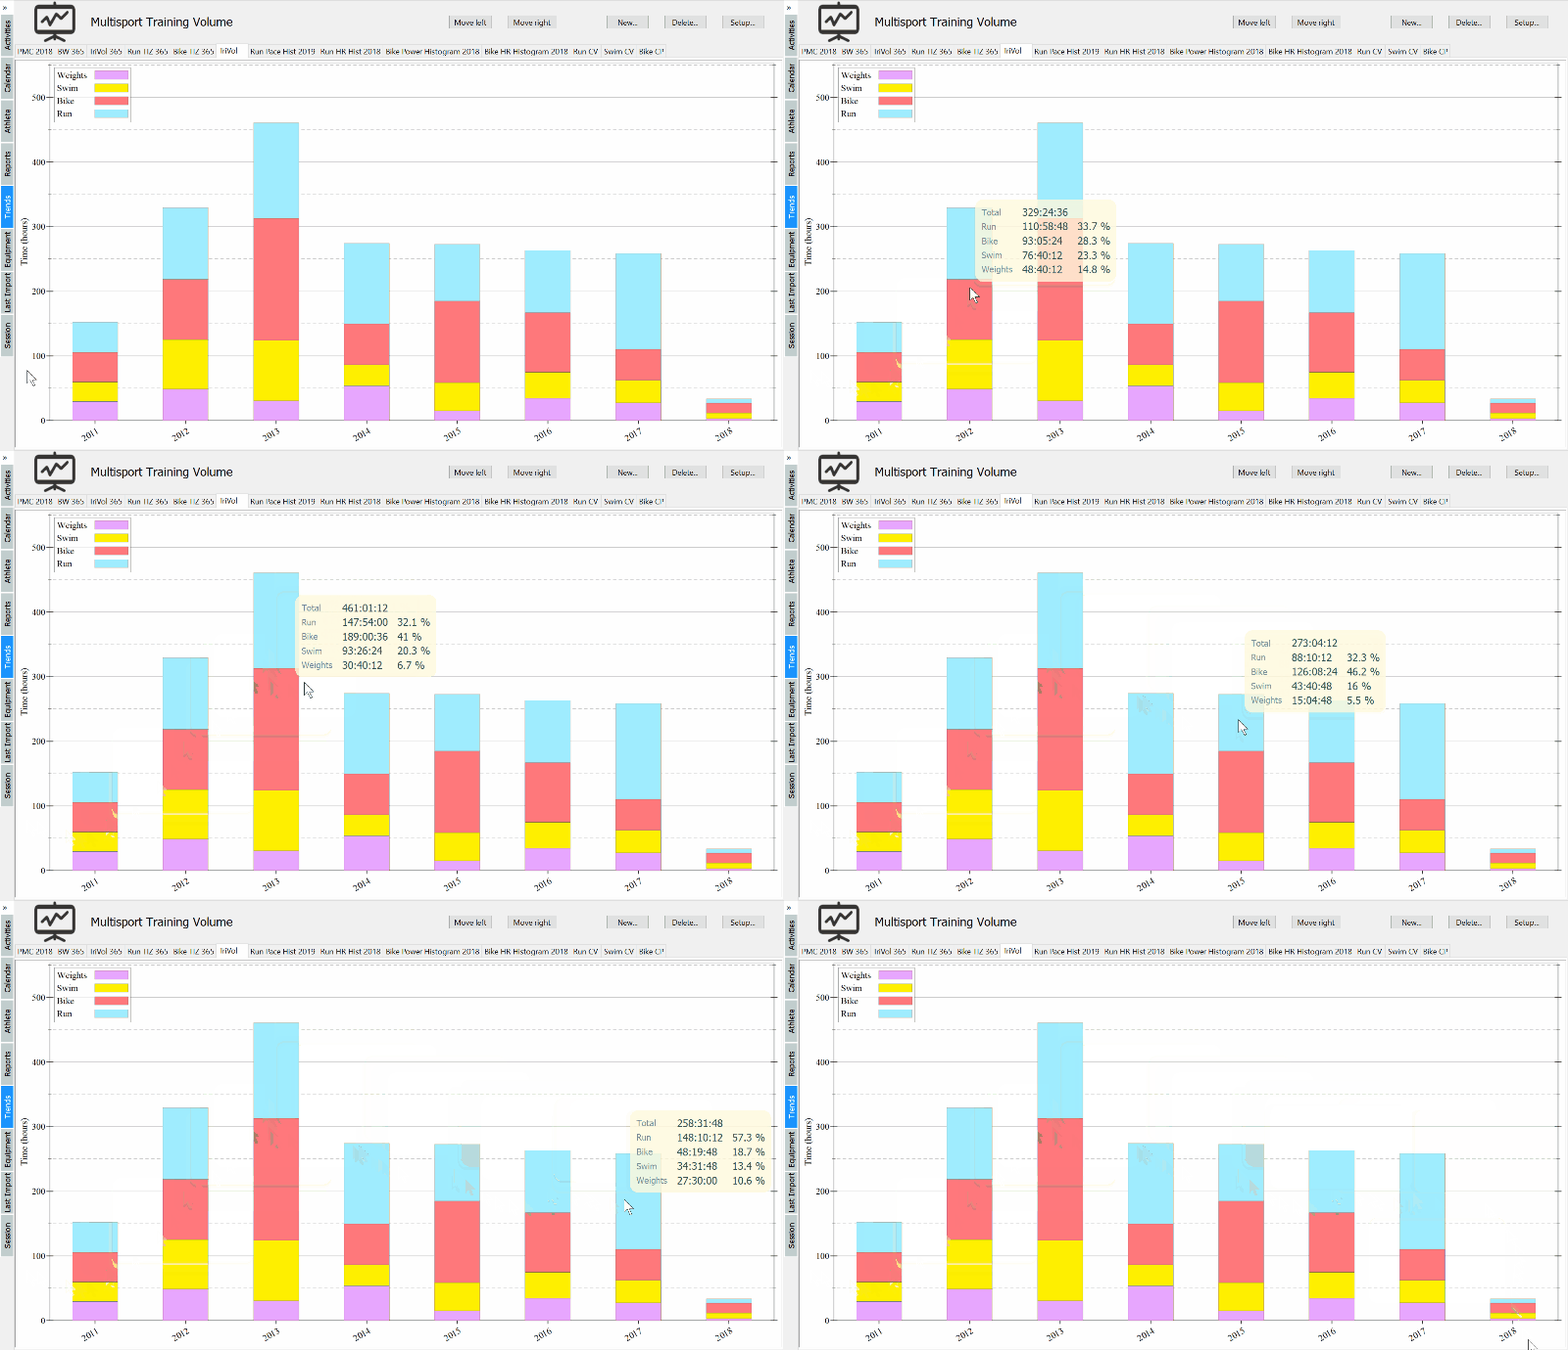
Histogram plots pose a special challenge as the plot X domain does not directly represent the histogram slots. To convert an X plot coordinate back into the histogram slot, the following information is used:
- The X domain is the real axis, starting at 0 by default
- The distance between each histogram bar is specified by the
discrete-histogram-skipparameter or the#:skipargument to thediscrete-histogramrenderer - The width of each histogram bar is one minus
discrete-histogram-gap, or the#:gapparameter passed to the renderer. - Multiple histograms can be shown, each having a different starting point, as specified by the
#:x-minparameter
The function below converts an X position back to the histogram series and the slot within that series:
1 2 3 4 5 6 7 8 9 10 |
(define (xposition->histogram-slot xposition (skip (discrete-histogram-skip)) (gap (discrete-histogram-gap))) (let* ((slot (exact-floor (/ xposition skip))) (offset (- xposition (* skip slot))) (series (exact-floor offset)) (on-bar? (< (/ gap 2) (- offset series) (- 1 (/ gap 2))))) (if on-bar? (values series slot) (values #f #f)))) |
The example in the image above is implemented in the plot-hover-callback method in the rkt/trends-trivol.rkt file. There are other examples of adding overlays to histogram plots in the rkt/inspect-histogram.rkt, rkt/trends-hist.rkt, rkt/trends-tiz.rkt and rkt/trends-vol.rkt files.
Summary of the new plot-snip% methods
The following methods were added to the snip% object returned by plot-snip%:
1 2 3 4 5 6 7 8 9 10 11 12 13 14 15 16 17 18 19 20 21 22 23 24 25 26 27 28 29 30 31 32 33 34 35 36 37 |
(send snip set-mouse-callback callback) callback: (or/c #f (-> (is-a?/c 2d-plot-snip%) (is-a?/c mouse-event%) (or/c #f number?) (or/c #f number?) any/c)) (send snip clear-overlays) (send snip refresh-overlays) (send snip add-mark-overlay x y #:radius (r 10) #:pen (pen #f) #:brush (brush #f) #:label (label #f) #:label-offset (offset 10) #:label-font (font #f) #:label-fg-color (fg-color #f) #:label-bg-color (bg-color #f)) (send snip add-vrule-overlay x #:pen (pen #f)) (send snip add-hrule-overlay y #:pen (pen #f)) (send snip add-xrule-overlay x y #:pen (pen #f)) (send snip add-vrange-overlay xmin xmax #:brush (brush #f)) (send snip add-hrange-overlay ymin ymax #:brush (brush #f)) (send snip add-rect-overlay xmin xmax ymin ymax #:brush (brush #f)) (send snip add-general-overlay x y draw-fn width height #:offset (offset 10)) draw-fn: (-> (is-a?/c dc%) number? number?) |
set-mouse-callback arranges for CALLBACK to be invoked when the mouse hovers over the plot, or when #f is passed, disable the callback. When a hover callback is active, the default “zoom on mouse drag” behavior of the plot snip is disabled.
The callback is invoked with the snip, the mouse event and the X, Y coordinates where the mouse is. The X, Y coordinates are in plot coordinate system, the domain over which data is being plotted.
The CALLBACK will also be invoked with X and Y being #f when the mouse is over the plot snip, but outside the actual plot area.
The snip% object passed to the callback will always be the one that generated the event and it should be used to add any overlays. Plot snips can be copied (they certainly are when they are shown in DrRacket), and it is easy to receive hover events from a copy and adding overlays to the original.
clear-overlays will clear all overlays added to the snip. The overlays are only cleared when this method is called, so a callback that adds overlays as the mouse moves should start by clearing the previous overlays.
refresh-overlays will refresh the plot area and draw the overlays. Overlays are not drawn when they are added, so a callback that adds overlays should finish by refreshing the overlays. Originally, each of the add-*-overlay function contained an internal refresh, but this resulted in the plot being refreshed too many times: once after each overlay was added.
add-mark-overlay will add a marker overlay at position X Y on the plot (X and Y are in plot coordinates). The marker is a circle of RADIUS drawn with PEN and BRUSH, or if these parameters are #f a default pen and brush is used. If RADIUS is 0 or negative, the circle is not drawn, this can be used to draw the LABEL only.
LABEL, if not #f, is a string drawn next to the marker, it will be offset in X and Y axes by OFFSET pixels and will be drawn in one of the “top-right”, “top-left”, “bottom-right”, “bottom-left” positions such that the label is always inside the plot. For example, the label is drawn top-right of the marker by default, but if this would result in the label being drawn off screen on the right, it will be moved to “top-left” position.
FONT, FG-COLOR and BG-COLOR are the font, foreground, and background colors for the label. If they are #f, default values are used.
add-vrule-overlay adds a vertical line at position X (in plot coordinates) using PEN.
add-hrule-overlay adds a horizontal line at position Y (in plot coordinates) using PEN.
add-xrule-overlay adds both a vertical and horizontal lines to the plot such that they intersect at X, Y (in plot coordinates). The lines are drawn using PEN. This method is equivalent to adding a vertical line at X and a horizontal line at Y, but it is more efficient.
add-vrange-overlay adds a rectangle overlay between XMIN and XMAX, in plot cordinates, for the entire height of the plot.
add-hrange-overlay adds a rectangle overlay between YMIN and YMAX, in plot cordinates, for the entire width of the plot.
add-rect-overlay adds a rectangle overlay between the points XMIN, YMIN, XMAX, YMAX, in plot coordinates.
add-general-overlay will add an overlay that is drawn by a user specified function, DRAWN-FN, at X Y (in plot coordinates) adjusted by OFFSET (in pixels) to either “top-right”, “top-left”, “bottom-right”, “bottom-left”, such that the drawing area is visible on the plot. WIDTH and HEIGHT represent the dimensions of the picture that will be drawn by DRAWN-FN and they are used to determine the adjustment position relative to the X, Y coordinates.
The function will be invoked with a draw context and X, Y coordinates (in DC coordinates).
This method can be used to draw a pict at a specified position, by using a wrapper such as shown below. This was not included in the plot interface, to avoid a dependency of the plot package on the pict package.
Source code
You can find the code for the updated plot library here, note that the code is on the “ah/interactive-overlays” branch. You will need to install this as a local package. If you don’t know how to do that, this post may help.
There is also a pull request to get these changes back into the main plot library.